
If you are interested in Cloud computing and System z, here is a webcast you may find interesting.
You can attend this complimentary webcast to learn the value of automating your service environment on System z. Analyst Joe Clabby, of Clabby Analytics, will discuss the importance of service management automation, and why it is a key requirement for virtualization and Cloud computing. You’ll come away with a good understanding of what an integrated service management strategy should be, and the requirements to be able to integrate business processes across the enterprise and consolidate complex workloads into highly available automated solutions using IBM’s Tivoli System Automation products on System z.
The event is January 13th, 2011 at 11 AM Eastern time. Here is a link to sign up:
http://www.ibm.com/software/os/systemz/webcast/jan13/index.html?S_TACT=110GU00M&S_CMP=5x5
Wednesday, December 29, 2010
Monday, December 27, 2010
Learn about zSecure in a free webcast
The Security zSecure suite provides cost-effective security administration, improves service by detecting threats, and reduces risk with automated audit and compliance reporting. On January 20th, 2011 IBM Tivoli will offer a free webcast to talk about the benefits of zSecure.
Register now for this webcast by logging onto ibm.com/software/systemz/webcast/jan20
Wednesday, December 22, 2010
Timed screen facility (TSF)

Timed screen facility (TSF) is a useful tool that's part of the Classic interface. TSF allows you to have the Classic interface execute a screen space at a specified time.
There are certain commands you need to know in order to use TSF. First, you can issue .TSF00 to list what timers (if any) are currently specified (see the example). You need to enble TSF via the .TSFON command. Next you need to enable Automatic update mode (using the .AUPON command). It's important to remember that for the timers to work, you need to have an active OMEGAMON session running in auto update mode.
To set the timer, you need to enter a timer and command in the time slot, such as .TSF01 for timer number 1. You enter a time and the screen space name, as I show in the example. Once this is done, you let the session run in auto-update, and then when the timer is hit, the screen space will execute (as I show at the bottom of the example).
TSF is handy because you can execute any Classic screen space based on time of day or day of week. You can have OMEGAMON execute a screen, or set of screens at off hours, and have the screen execute a LOG command to log and spool out the output of the commands. This is very handy and very convenient.
Friday, December 17, 2010
More useful Classic interface commands

We've covered the notions of major and minor commands, and I've shown you some short cuts on how to figure out what commands are available. The next step is to learn a few of the edit commands. You will want to know how to edit and save screen spaces because in many scenarios, if you are using the automated screen functions I've mentioned earlier, you will do this with screens you've crafted and built to suit your own technical needs.
To edit screens without having the commands execute you can use what is called definition mode. To get into definition mode it's /DEF ON (as I show in the example). To get out of definition mode it's /DEF OFF. You can enter your major and minor commands, as we've discussed before.
Once you have the commands you need in the screen space, you can save the screen space by using the command /SAVE screen. This will save the screen. If you are updating a screen that's already created, then use /REP screen to replace the screen (as I show in the example). To invoke the screen manually you can type the screen name in the command line (again as I show in the example).
Some other useful edit commands:
.. - type .. and then hit enter to clear out whatever is after .. on the panel
.d - to delete a line
.d 2 - to delete 2 lines
.i - to insert a line
.i 2 - to insert 2 lines
> - use this in column 1 to indicate a comment line
.rc - repeat command - this will wrap around the commands if needed
Try them out and try making some of your own Classic screen spaces.
Now that we've covered the basiscs, I will nest go in to how to invoke and automate using Classic screen spaces (including ones you've customized).
Thursday, December 16, 2010
Useful Classic interface commands

When looking at using the Classic interface, it's useful to know the essentials of the Classic interface command structure. That starts with the notion of Major and minor commands.
All Classic product provided screen spaces are composed of these Major and minor commands. In the example, on the top portion of the screen shot, we see the Major command, ALLJ (for all jobs), and three minor commands, cpu, dprt, and ecsa. Think of it as the minor commands provide detail for the corresponding Major command. Also, notice that the Major commands are in ALL CAPS. The minor commands are all in lower case.
Not familiar with all the commands? You can break down and read the manuals. But, you can also use some classic commands to list the Major commands. For example, you can do H.MJC to list the Major commands, and provide a one line help for each. I show an example of this in the screen shot.
Don't know all the minor commands for a Major? No problem, just execute .EXM underneath a given Major command, and it will execute the minor commands for a given Major (as I show in the example).
Knowing how to get the commands is a great starting point for what we will be discussing next.
Monday, December 13, 2010
Cool Classic interface tricks
I've done quite a few posts over the past few weeks on the Tivoli Portal, and its unique capabilities. But, I don't want to keep the sole focus on the Tivoli Portal. Classic 3270 interface has some nice capabilities that you may not know about.
Classic interface is very customizable, built around the notions of major and minor commands, menus, etc. You can make custom screen spaces to target specific technical requirements, or to focus on a specific user or audience.
It's easy to customize Classic screen spaces, and you can do some very nice things with Classic. But, there are other interesting things you can do, as well. For example, did you know you can have the Classic interface execute a screen space based on such things as time of day, or if a specific Classic exception has been hit? Did you know that you can have one screen space execute, and then call and execute another screen space? Did you know about the ability of the Classic interface to execute screens, and then log the output?
I will do a series of posts that go into examples of how to use features, such as Timed Screen Facility (TSF), Automated Screen Facility (ASF), Auto-update, Exception Logging Facility, and other cool Classic techniques.
Friday, December 10, 2010
Availability alerts using situations

When creating an availability alert or creating a workspace focused on z/OS availability, it may be useful to create some alerts focused on the availability of key tasks. I showed and example earlier of how you can use the integration of System Automation (SA) with the TEP to create an intelligent task/resource availability alert based upon the logic encoded within SA.
What if you do not have SA? What are ways to create some task availability alerts? One easy starting point is to use OMEGAMON z/OS, and to create address space alerts using the situation support for the 'Missing' function. In the example I show, if any of the tasks in the list are detected by the situation to be missing, an alert will fire.
This is an offshoot of the Key Task light from the OMEGAMON MVS CUA interface. The advantage of using the TEP and situations are two-fold. First, you can add additional logic in a situation that you cannot have in the basic Key Task light in CUA. The second thing is that you can make situations time of day sensitive a couple ways. One is to add time sensitivity into the situation logic. Another way is to manage the situations using policies to start/stop them.
Using policies to start and stop situations based upon the needs of the installation is a powerful, and easy to use technique. You can manage the alert, make it time sensitive, and not have to code all the logic into the situation. Just let the policy manage it.
Wednesday, December 8, 2010
Using custom queries to analyze situation distributions

If you want an easy way to understand what situations are distributed and where they are distributed (without having to get into the situation editor for each one), this technique may prove useful.
You can create 2 custom queries that go against the TEMS. The first is:
SELECT DELTASTAT, UNIQUE(SITNAME) FROM O4SRV.ISITSTSH WHERE DELTASTAT = 'S';
This will show a list of what situations are distributed.
The second queries is:
SELECT NODEL, OBJNAME FROM O4SRV.TOBJACCL WHERE OBJNAME = $SITNAME$;
This will work to show where a situation is distributed (passing a variable SITNAME).
You can go from the first query on the first workspace to the second using a link and passing SITNAME as the variable for the drill down. Above is an example of what you would get.
This is a good exercise in custom queries and using workspace links. Here is a URL that describes the set up in more detail:
http://www-01.ibm.com/support/docview.wss?uid=swg21454974&myns=swgtiv&mynp=OCSSZ8F3&mync=RTuesday, December 7, 2010
Online ITM problem solving tools
Here's a web page that consolidates a list of useful support links, and some online assist and help functions for support and documentation for IBM Tivoli Monitoring (ITM).
Here's the link:
http://www-01.ibm.com/support/docview.wss?uid=swg21303361&myns=swgtiv&mynp=OCSSZ8F3&mynp=OCSSLSFT&mynp=OCSSLSDR&mync=RWednesday, December 1, 2010
For the "well dressed" mainframe fan

If you are a System z mainframe fan, here's a chance to let the whole world know about it. An amusing array of mainframe t-shirts. Here's a link for more info:
Monday, November 29, 2010
Information on IBM Support
Here is a link to an interesting web page that provides a lot of information on using IBM Support and items like the Support Portal and My Notification. There are links on this page for instructional videos and a software support handbook. This is a good starting point for navigating the various facilities of IBM support.
http://www-01.ibm.com/support/docview.wss?uid=swg21439079&myns=swgtiv&mynp=OCSSBNJ7&mynp=OCSSNFET&mynp=OCSSLKT6&mynp=OCSSSHRK&mynp=OCSSPLFC&mynp=OCSSZ8F3&mynp=OCSSRM2X&mynp=OCSS2GNX&mynp=OCSSVJJU&mynp=OCSSGSPN&mynp=OCSSGSG7&mynp=OCSSTFWV&mynp=OCSSPREK&mync=R
http://www-01.ibm.com/support/docview.wss?uid=swg21439079&myns=swgtiv&mynp=OCSSBNJ7&mynp=OCSSNFET&mynp=OCSSLKT6&mynp=OCSSSHRK&mynp=OCSSPLFC&mynp=OCSSZ8F3&mynp=OCSSRM2X&mynp=OCSS2GNX&mynp=OCSSVJJU&mynp=OCSSGSPN&mynp=OCSSGSG7&mynp=OCSSTFWV&mynp=OCSSPREK&mync=R
Address space CPU usage info in OMEGAMON XE For z/OS
APAR OA34505 has some interesting information about the z/OS Address Space CPU usage display. Apparently it was noted that there was an inconsistency between how CPU % usage was being calculated in the OMEGAMON XE Tivoli Portal Address Space workspace versus how the comparable data was being calculated and displayed in the OMEGAMON II 3270 interface.
It seems the calculation in the TEP has been the sum of SRB CPU + TCB CPU. However in the OMEGAMON II for MVS interface the calculation has been SRB CPU + TCB CPU + Enclave CPU. The net result is that when looking at tasks in the TEP, you may see lower than expected CPU usage numbers.
For more information on the APAR, here's the link:
http://www-01.ibm.com/support/docview.wss?uid=swg1OA34505&myns=swgtiv&mynp=OCSS2JNN&mync=R
Wednesday, November 24, 2010
Adding HTTP information to your end to end view


In earlier posts I've written about how you can use OMEGAMON XE For Mainframe Networks to add network level information to your mainframe monitoring views. For example, you can monitor network traffic to/from CICS, IMS, or DB2, and look at such things as byte counts, round trip time, round trip variance, and network excpetions. This type of information can be a useful supplement to host response time captured by OMEGAMON XE for CICS or IMS.
Another interesting set of metrics you can add to the mix is HTTP monitoring. Many applications in most enterprises have a flow that may start with some form of user interaction at an HTTP server. That HTTP server will often interfface with some form of middleware (MQ, WebSphere, J2EE, you name it), and then to either CICS, IMS, DB2 on z/OS or all of the above. To have a more complete monitoring picture, it's nice to have HTTP information as part of the monitoring view.
Depending upon which Tivoli monitoring components you have licensed, you may have access to a tool called the Universal Agent (UA). UA is an interesting tool in that you can use it to pull in information from a wide variety of data sources. Among the data providers is file, socket, SNMP, and HTTP. The HTTP data provider allows you to monitor URLs, and track the status and response time of these URLs on an ongoing basis in the Tivoli Portal. UA is a great tool to add the additional layer of performance/availability data to the Portal.
Here's how you can add the information to your portal view. First you need to enable the HTTP data provider as an option in UA. To do that you go to Manage Tivoli Services and select the option to configure or reconfigure UA. When you click through that dialog you will get to a notepad editor pop-up. There you add HTTP to the start-up options (as I show in the example). You save the file, and re-cycle the UA process. The next step is to add a URL to be monitored. From the navigation tree in the portal, you select a Take Action, and select Add URL (again as I show in the example). You enter a URL to monitor in the pop-up, click OK and you are ready to go.
The data you get is interesting, and useful. For each monitored URL you will get a status, and a response time, along with page size and other information. Good stuff to add your portal views.
Monday, November 15, 2010
Tivoli User Community webpage
A good source of information on Tivoli products, plus information on such things as Tivoli user groups and other events, is the Tivoli User community web page.
Here is a link to the Tivoli User Community web page:
http://www-306.ibm.com/software/tivoli/tivoli_user_groups/links.html
Here is a link to the Tivoli User Community web page:
http://www-306.ibm.com/software/tivoli/tivoli_user_groups/links.html
Thursday, November 11, 2010
IBM Tivoli is looking for your feedback
IBM Tivoli is piloting a new request for enhancement (RFE) web site for a subset of the IBM Tivoli products. The product list includes TADDM, ITCAM for Transactions, OMEGAMON XE for CICS, OMEGAMON XE for IMS, OMEGAMON XE for Storage, OMEGAMON XE for z/VM and Linux, OMEGAMON XE on z/OS, ITRPM, TSPM, and TWS.
Customer input is important to improving the products, and I encourage everyone to check out this web site, and add your input. I can speak from experience, that I can talk to product development and R&D all day long, but customer opinion is what counts most.
Here's the URL:
http://www.ibm.com/developerworks/rfe/tivoli/
Wednesday, November 10, 2010
Improvements to OMEGAMON DB2 Near Term History
OMEGAMON XE For DB2 has a Near Term History (NTH) function that is one of the more popular and useful features of the tool. In NTH you can go back in time and look at detailed historical information at the DB2 subsystem (Statistics) and/or the DB2 application (Accounting) level. This is essential information for being able to analyze performance issues after the fact.
DB2 Accounting records, in particular, have the potential to consume a fair amount of DASD space. The records themselves are large, and DB2 may generate many of them, as many as millions a day in many shops. How far back in time you can go in NTH is a function of how many records you need to store, and how much space you allocate in the NTH collection files.
One little known aspect of NTH is that you have the ability to allocate and use more than the three collection datasets you get by default. It used to be you could go up to ten datasets. Now with recent enhancement, you can go up to twenty history collection datasets. This allows for even more storage space, and the ability to keep more history data online.
For more information on this enhancement, check out this link:
http://www-01.ibm.com/support/docview.wss?rs=0&q1=Near+Term+History+%28NTH%29+VSAM&uid=swg21452497&loc=en_US&cs=utf-8&cc=us&lang=all
Wednesday, November 3, 2010
SA System Automation integration with the Tivoli Portal

The Tivoli Enterprise Portal (TEP) is more than just an OMEGAMON thing. Many other Tivoli tools, such as the storage tools and SA System Automation also integrate within the TEP. I've been working with a customer on an availability dashboard concept for managing z/OS. One of the tools at our disposal is System Automation, and we have it integrated with the TEP.
In the example I show, we have some of the information from the SA agent, and I use that data to alert on key z/OS task availability. One aspect of task availability is to alert not only on when a task is down, but to factor in that there may be times when the task is supposed to be down (such as for maintenance, etc). The SA agent interface provides information, such as resource status, but also shows the desired status for the resource. In other words, you can alert on when the task is down, and also factor in if the task is supposed to be down.
In the example, I show part of the prototype dashboard, and I show an example situation. Here I'm looking at both the status of the resource, and the desired status. In other words, only alert if the resource is down, but it is supposed to be up (at least as far as SA knows).
Thursday, October 28, 2010
OMEGAMON XE for Mainframe Networks V420 FP3 New Features
FP3 is available for OMEGAMON XE For Mainframe Networks (4.2.0-TIV-KN3-FP0003). There are a lot of interesting features/enhancements in this fixpack including the following:
z/OS(R) v1.12 support - New workspaces and over 300 new attributes
Reduced SNMP footprint at a lower CPU cost for data collection
New product-provided situations
Enhancements to Connections node workspaces
More detailed and useful DVIPA data is now reported
New configuration options for more granular data collection
Enhancements to OSA support
Support for the PARMLIB configuration method
That's a lot of stuff, so if you have OMEGAMON for Mainframe Networks this is worth taking a look at.
Wednesday, October 27, 2010
What's in OMEGAMON DB2 V5.10
As I mentioned yesterday, OMEGAMON XE For DB2 PM/PE V5.10 is now generally available, to coincide with the release of DB2 V10. OMEGAMON DB2 V5.10 is a very robust new release with a lot of interesting feature/function included within the tool.
Some of the enhancements include:
- Expanded support for end-to-end SQL monitoring via Extended Insight
- Expanded data shring group level support
- Spport and exploitation for DB2 10 for z/OS, including support for new and changed performance metrics, such as: Statistics (more buffer pools, virtual storage, 64bit values, SQL statement cache extensions), Accounting (Lock/latch wait time separated), New ZPARMS, Audit (various new DBA privileges), and Performance traces.
There are also interesting enhancements in the area of integrated monitoring, and integration with IBM Tivoili ITCAM.
There is quite a bit here, and I will be posting more detail on what is new and interesting in the tool.
Tuesday, October 26, 2010
Good stuff! DB2 V10 and OMEGAMON DB2 V510
New releases are always exciting to report, and now we have a new version of DB2 for z/OS, DB2 Version 10, and an OMEGAMON DB2 to go with it, OMEGAMON DB2 V5.10.
For more information on DB2 V10, here is a link:
http://www-01.ibm.com/software/data/db2/zos/
For information on new versions of tools for DB2 V10 (including OMEGAMON), here is a link:
http://www-01.ibm.com/cgi-bin/common/ssi/ssialias?infotype=an&subtype=ca&htmlfid=897/ENUS210-345&appname=isource&language=enus
Friday, October 15, 2010
Upcoming webcast on Tivoli and zEnterprise
On October 28th there will be a free webcast on "Tivoli for zEnterprise – Why integrated service management matters". I've posted many times on the value of integration when defining and building a performance and availability management strategy. The webcast will discuss how Tivoli solutions can help you prepare for a better way of integrating service management under the new IBM zEnterprise “system of systems” and manage your data center as one.
The webcast is on October 28th at 11 AM, Eastern Time. Here is a URL to sign up:
http://www-01.ibm.com/software/os/systemz/webcast/28oct/
The price for the webcast is right, it's free!
The webcast is on October 28th at 11 AM, Eastern Time. Here is a URL to sign up:
http://www-01.ibm.com/software/os/systemz/webcast/28oct/
The price for the webcast is right, it's free!
Thursday, October 14, 2010
Adding z/VM and Linux on z to the monitoring mix

If you are running Linux on z, or thinking about Linux on z, be aware that there is an OMEGAMON solution crafted specific to the Linux on z environment. OMEGAMON For z/VM and Linux is an interesting tool in that it's an integrated tool that will monitor both the z/VM resources and activity, and the Linux systems running within that environment. OMEGAMON XE for z/VM and Linux is a Tivoli Portal based solution, which means that you can take the information from the monitoring processes and integrate it with information from other IBM Tivoli monitoring tools. Here I show an example of how you can integrate information from both z/VM and Linux with information from other z/OS monitoring (and for that matter non-z/OS too), and have it all on the same screen.
The big advantage of OMEGAMON for z/VM and Linux is the ability to easily integrate information using the Tivoli Portal. The tool pre-reqs the Performance Tool Kit, but other than that it installs very similar to any other Tivoli monitoring tool.
Wednesday, October 13, 2010
New cumulative fixpack for OMEGAMON DB2 available
There is a new fixpack available for OMEGAMON DB2 (4.2.0.2-TIV-KD5-IF0003). In addition to the usual fixes for invalid fields, additional help, and other various fixes, this fixpack has one or two interesting items. First is the addition of more SQL call counters at the DB2 subsystem and DB2 thread level. The other enhancement is the addition of the DB2 Cancel command attribute column to more workspaces.
The value of having the Cancel command added to these other tables/workspaces is now it is easier and more convenient to take advantage of the DB2 Cancel command from more workspaces within the TEP.
The value of having the Cancel command added to these other tables/workspaces is now it is easier and more convenient to take advantage of the DB2 Cancel command from more workspaces within the TEP.
Friday, October 8, 2010
Considerations for CICS task history
 I recently had a customer with some questions about how OMEGAMON can gather and display CICS task history. Her goal was to be able to have an ongoing history of problem CICS transactions, with the ability to do an analysis after the fact of problem transactions.
When looking at OMEGAMON CICS you have several options for collecting history. First you have the Task History option. This will collect detailed history for CICS transactions to an ongoing task history file that may be viewed in 3270 interface or in the Portal. You can easily filter the display for specific transactions and look for outliers. The main limitation of Task History is that you can only keep what is in the VSAM file used for data collection. It is, by design, a wraparound file. The amount of history kept is a function of the size of the file.
A second option is that you can report from the SMF 110 records created by CICS. OMEGAMON provides the ability to add additional data (like MQ counts, etc.) to these records. The advantage of this approach is that you can keep data for longer periods of time. The down side is that the data must be accessed and analyzed via a batch mechanism, you don't have an "online" method in OMEGAMON to go back in time and look for outliers when using the SMF data.
The third option is to use the Tivoli Portal and to use the Tivoli Data Warehouse (TDW) feature. TDW can snapshot data in the Portal on an interval basis. The interval is definable by the user when you specify the history collection. The data may be kept at the agent (TEMA) level, or optionally sent to the TDW. The advantage of this approach is that it is easy to set up, and the data is readily accessible online, even data going far back. The problem is that the data is purely snapshot in nature. Even on a 30 second interval (as seen in the example), you can have a lot of transactions flow through between snapshot intervals that may not get recorded. It may be that if your goal is to capture outliers that run longer than the snapshot interval, this will work. Otherwise, maybe not.
So to get back to the original question. What if you want history that can be kept on a long term basis to look for outliers and problem trans? That is where maybe you consider other solutions, such as CICS Performance Analyzer or Tivoli Decision Support. What each of these solutions provide is a means to collect the history data and keep it for longer term analysis.
Wednesday, October 6, 2010
Some key resource links for information on Tivoli solutions
Here are four key resources that you can use to assist with learning about Tivoli products and how to use them. These resources provide a wide range of information from the standard product documentation to best practices to videos and tutorials. I hope you find this information helpful.
Tivoli Documentation Central: Get quick access to all the documentation for Tivoli products. This includes all available versions of the product information centers, wikis, IBM Redbooks, and Support technotes.
http://www.ibm.com/tivoli/documentation
Tivoli Wiki Central : Here is where you can access best practices, installation and integration scenarios, and other key information provided by IBM Tivoli subject matter experts. Everyone is invited to participate by contributing their comments and content on Tivoli wikis.
http://www.ibm.com/tivoli/wikis:
Tivoli Media Gallery: View tutorials, demos, and videos about Tivoli products. This includes product overviews and quick 'How To' instructions for completing tasks with Tivoli applications.
http://www.ibm.com/tivoli/media
IBM System z Advisor Newsletter: For System z customers, this newsletter provides monthly features, news, and updates about IBM System z software. This newsletter is e-mailed each month, and the link above provides a place for customers to subscribe.
http://www-01.ibm.com/software/tivoli/systemz-advisor
Tuesday, October 5, 2010
Collecting appropriate log data for IBM support
When you are having an issue with the IBM Tivoli Monitoring infrastructure, IBM support will often ask you for various logs for analysis purposes. There is a procedure called PDCOLLECT that will aid in gathering all the various logs you will commonly need. Here is a link to a write-up on how to use PDCOLLECT:
http://www-01.ibm.com/support/docview.wss?uid=swg21446655&myns=swgtiv&mynp=OCSSZ8F3&mync=R
http://www-01.ibm.com/support/docview.wss?uid=swg21446655&myns=swgtiv&mynp=OCSSZ8F3&mync=R
Thursday, September 30, 2010
New capability for the z/OS Event Pump
The Event Pump for z/OS is an IBM tool that enables the integration and forwarding of z/OS events from z/OS to IBM Netcool OMNIbus. The Event Pump can pass event information, plus resource status, and the severity of an event to OMNIbus. The mechanism is very similar to how OMEGAMON XE uses the EIF interface to pass alerts to OMNIbus.
There is one APAR of interest that just became available last week, OA34085. This particular APAR enables the integration of BMC Mainview alerts into the Event Pump. So the bottom line is, if you are BMc Mainview customer, and you have IBM OMNIbus for event management, you can now more easily forward alerts and events from Mainview into OMNIbus.
For more information, here is a URL:
http://www-01.ibm.com/support/docview.wss?uid=swg1OA34085&myns=swgtiv&mynp=OCSSXTW7&mync=R
Tips on customizing "Take Action" in the Tivoli Portal

The "Take Action" function in the Tivoli Portal (TEP) can be very useful. One of the nice things about "Take Action" is that it is very flexible and customizable. You can easily set up a pre-arranged set of commands and then select the desired command from a drop down list. One thing that makes "Take Action" flexible is the ability to use the attribute substitution function as part of the command definition. What this means is that you can have the Action command insert an attribute where needed to customize the command to be submitted. Here is an example of how you can use this function, in this example to set up a DB2 Thread Cancel function.
Friday, September 24, 2010
Webcast on "Monitoring Options in OMEGAMON XE for Messaging"
There will be a free webcast on October 7th on "Monitoring Options in OMEGAMON XE for Messaging" . The time will be 11 a.m., Eastern Daylight Time, 3:00 p.m. GMT.
The teleconference will discuss monitoring options to efficiently detect and identify root causes of your WebSphere MQ and Message Broker performance issues.
Here is a link to sign up for the event:
http://www.ibm.com/software/systemz/telecon/7oct/
The teleconference will discuss monitoring options to efficiently detect and identify root causes of your WebSphere MQ and Message Broker performance issues.
Here is a link to sign up for the event:
http://www.ibm.com/software/systemz/telecon/7oct/
Thursday, September 23, 2010
z/OS 1.12 available shortly
z/OS Version 1 Release 12 will be ready for ordering as of Friday, September 24th.
z/OS V1.12 can provide automatic and real time capabilities for higher performance, as well as fewer system disruptions and response time impacts to z/OS and the business applications that rely on z/OS.
Interesting "new stuff" includes new VSAM Control Area (CA) Reclaim capability, a new z/OS Runtime Diagnostics function is designed to quickly look at the system message log and address space resources and can help you identify sources of possible problems, z/OS Predictive Failure Analysis (PFA) for managing SMF, performance improvements for many workloads, XML enhancements, networking improvements, and improved productivity with the new face of z/OS called the z/OS Management Facility (5655-S28).
Here is a link for more information on z/OS V1.12:
http://www-03.ibm.com/systems/z/os/zos/
Thursday, September 16, 2010
A new photonic chip
While this does not have anything to do specific to z/OS or Tivoli, I thought it was an interesting read in Financial Times.
"A new photonic chip that works on light rather than electricity has been built by an international research team, paving the way for the production of ultra-fast quantum computers with capabilities far beyond today’s devices."
Sounds like an interesting breakthrough. Here's a link to the story:
http://www.ft.com/cms/s/0/8c0a68b0-c1bc-11df-9d90-00144feab49a.html
Friday, September 10, 2010
OMEGAMON XE For Storage V4.20 Interim Feature 3 enhancements
OMEGAMON XE For Storage V4.20 Interim Feature 3 has some interesting new enhancements. Some of these enhancements include the following:
DFSMShsm Common Recall Queue support
Display request info for all queued and active requests in the CRQPlex on a single workspace
Enable cancelling HSM requests from the CRQPlex Request workspace - even across systems
Provide Storage Groups and User DASD Groups space used stats in units of tracks and cylinders Multi-volume datasets now displayed as single entity in the Dataset Attribute Database reports Reports will now contain a column indicating whether a dataset is multi-volume or not
For a multi-volume datasets, space data will be summarized in a single row
Ability to identify TotalStorage array problems at the ranklevel
Situation alerts for DDM Throttling, Raid Degraded condition and RPM Exceptions
Support for issuing Storage Toolkit commands at a group level
If you have OMEGAMON Storage, here is a link for more info:
http://www-01.ibm.com/support/docview.wss?uid=swg24027743&myns=swgtiv&mynp=OCSS2JFP&mync=R
Tuesday, September 7, 2010
Getting started using ITMSUPER
I've done some earlier posts on using ITMSUPER, and some of the useful information that is contained within ITMSUPER. ITMSUPER is a very useful utility that is easy to use, and provides quite a bit of diagnostic information as to what is happening within your Tivoli monitoring infrastructure.
Here is a link to a brief "Getting started using ITMSUPER". This procedure includes a link to where you can go to get ITMSUPER.
Here's the link:
http://www-01.ibm.com/support/docview.wss?uid=swg21444266&myns=swgtiv&mynp=OCSSZ8F3&mync=R
Here is a link to a brief "Getting started using ITMSUPER". This procedure includes a link to where you can go to get ITMSUPER.
Here's the link:
http://www-01.ibm.com/support/docview.wss?uid=swg21444266&myns=swgtiv&mynp=OCSSZ8F3&mync=R
Thursday, September 2, 2010
Take advantage of snapshot history in OMEGAMON DB2

OMEGAMON DB2 has a very useful snapshot hsitory feature that is very granular and detailed. This particular history mechanism is different than the snapshot hsitory collected by the XE agent task for Tivoli Data Warehouse (TDW) history collection. The OMEGAMON DB2 snapshot hsitory can be collected on a frequent basis, provides considerable information, and is very useful for problem analysis. To access the OMEGAMON DB2 snapshot history, you need to enable and install the PE GUI interface (and yes you have access to this tool regardless of whether you run the PM or PE version of the product).
The example I have here shows how you can use the tool. Here I show two different views of DB2 active threads. The top one is from the current view, and the other is from several minutes prior. To change the history view you move the scroll bar I have highlighted. What's neat is you can easily move the scroll bar back and forth to get different point in time views of the system.
This feature is very useful, in particular for analyzing those problem scenarios where being able to go back in time and see the mix of applications running at the same time is key to understanding what is going on.
Monday, August 30, 2010
Upcoming webcast on NetView and zEnterprise
On September 30, 2010 at 11 AM, Eastern time, there will be a webcast titled "Tivoli NetView for z/OS in zEnterprise".
In this complimentary teleconference you can learn how IBM Tivoli NetView for z/OS addresses critical issues, including complexity, by providing the foundation for consolidating and integrating key service management processes in your zEnterprise environment. You’ll see how Tivoli’s NetView for z/OS-based integrated solutions can help you deliver value by improving the availability and resiliency of zEnterprise systems and applications, reduce the need for operator intervention, and fine-tune service delivery. With less unplanned downtime, there’s less impact on your business.
The speakers are Mark Edwards, Senior Product Manager, IBM Software Group and Larry Green, NetView for z/OS Architect, IBM Software Group.
Here is a link to sign up for the event:
http://www.ibm.com/software/os/systemz/telecon/30sep/index.html?S_TACT=100GV43M&S_CMP=5x5
Thursday, August 26, 2010
Leveraging the Situation Console

The Situation Event Console will show the situations open in a given monitoring environment, and provide drill downs for details on the situation alert. By default, the Situation Console is provided for the entire enterprise on the product provided Enterprise workspace.
What's nice is you can implicitly filter and optimize the Situation Event Console for your specific requirements, and the types of alerts you need to see. In this example I made a change to the product provided DB2 Messages workspace. I split the top DB2 message window, and then did a click and drag from the tool bar, and dropped the Situation Event Console icon on the DB2 workspace I'm editing. The result is now I have a Situation Event Console filtered for just DB2 alerts. You can do the same thing, for other managed system types, as well. This technique is an easy way to tune out the noise, and target the information you are most interested in when it comes to situation alerts.
Tuesday, August 24, 2010
OMEGAMON DB2 Messages Workspace

OMEGAMON DB2 V4.1 added support for DB2 message logging and management to the Tivoli Portal as an interim feature. The DB2 message feature has some interesting and useful capabilities, such as highlighting application failure/abend messages and tracking Deadlock/timeout/escalation messages. The default workspace will show the last 10 messages, and will highlight typical problem messages. But, as with any Tivoli Portal workspace, you can easily customize the workspace to your specific requirements.
Another nice usage of the DB2 Messages workspace is the ability to create situations based upon DB2 messages. In the example I show here I created an alert based upon a DSNL027I message. Notice also that you can take advantage of the ability to highlight information, such as for the DSN3201I error message.
If you want to try out the DB2 Messages feature, but do not see any messages appearing in the workspace, check on the following command:
F cccccccc,F PESERVER,F db2ssid,DB2MSGMON=Y
where ccccccc is the OM DB2 collector task, DB2 ID would be the DB2 you want to collect messages from.
The above modify will enable message collection to occur, and you should be able to see data in the workspace.
Friday, August 20, 2010
About Policies

Policies are an interesting and powerful feature of the Tivoli Enterprise Portal. Common usages of policies include such things as enabling a situation to issue multiple commands when true, stopping and starting situations as needed, and using multiple checks and command options with a single command flow. Policies provide a way to expand the command capabilities of the Tivoli Portal.
There are some things to consider when using policies. First, be aware that situations that are embedded within the policy logic are 'copies' of the original situation. In other words, if you take a commonly used situation and embed it within a policy, that situation logic will be run twice, once for the situation itself, and once for the policy. That, in and of itself, may not be a problem. But, be aware that if you are using a higher cost situation in a policy, you will be using that higher cost situation twice. Second, situations usually run within the agent task, but policies run within the TEMS infrastructure. Third, similar to the interval concept of situations, policies also have an inherent loop execution logic.
To know if any policies are connected to a given managed system, you can right click on the managed system within the Tivoli Portal and select 'Manage policies' to see what policies have been deployed.
Monday, August 16, 2010
Upcoming webcast on OMEGAMON installation and troubleshooting
On September 14th there will be a webcast on "IBM Tivoli OMEGAMON® XE for z/OS from Installation to Troubleshooting – PART1". This webcast will cover the following:
Omegamon XE for zOS:Installation and Configuration
Omegamon XE for zOS:Usage
Omegamon XE for zOS:Troubleshooting
Here is a link for more information on the event:
http://www-01.ibm.com/support/docview.wss?uid=swg27019462&myns=swgtiv&mynp=OCSS2JNN&mync=R
Omegamon XE for zOS:Installation and Configuration
Omegamon XE for zOS:Usage
Omegamon XE for zOS:Troubleshooting
Here is a link for more information on the event:
http://www-01.ibm.com/support/docview.wss?uid=swg27019462&myns=swgtiv&mynp=OCSS2JNN&mync=R
Friday, August 13, 2010
More on OMEGAMON z/OS currency maintenance
While browsing through my Google reader I noticed an entry titiled "ABENDs after upgrading level of z/OS". The symptom is various ABENDs (i.e. S0C1, S0C4, U0012, U1213, etc.) in the TEMS or in any of the OMEGAMON agents after upgrading your level of z/OS.
The bottom line is when you upgrade your level of z/OS, you need to be sure to apply OMEGAMON Currency PTFs to support that new level of z/OS, AND (let's not forget the AND) OMEGAMON Currency PTFs for any level of z/OS you skipped over. If you skip a level of z/OS (i.e. upgrade from z/OS 1.9 to z/OS 1.11), you need to apply the OMEGAMON Currency PTFs for the level(s) you skipped as well as the level to which you upgraded.
Here is a link to the document, and the document in turn includes links to recommended maintenance levels for z/OS 1.10, 1.11, and 1.12.
http://www-01.ibm.com/support/docview.wss?uid=swg21439161&myns=swgtiv&mynp=OCSS2JNN&mync=R
Thursday, August 12, 2010
Using ITMSUPER to understand the cost of situation processing

ITMSUPER is an excellent tool that can provide tremendous insight into what is happening in the IBM Tivoli monitoring infrastructure. ITMSUPER is available from the OPAL web site (see the link to OPAL on the right of this page). OPAL is a good source of handy tools and other goodies. ITMSUPER is one of the most useful.
There are many uses for ITMSUPER, analyzing situation processing is just one. In the example I show some of the typical output from ITMSUPER. I clicked on the line in the middle of the display "Cost of running situations". This display shows information on what situations are running within the given agent (TEMA) task. Note that the display also provides information on the situation interval, number of rows processed for the situation, and a relative cost of running the situation per hour. This is very good information to use to determine which situations are potentially more costly to run than others.
Monday, August 9, 2010
Upcoming webcast on z/OS storage management
On August 19th there will be a webcast on "IBM Tivoli System z Storage Management update: An integrated toolset for better insight, analysis and control".
This event will cover the IBM Tivoli storage management suite of solutions. In this session, examples to be discussed will include: how to pinpoint a critical address space not performing well and in real time and identify all the data sets and devices that the address space is using, reveal hidden errors in HSM control data sets that can result in data not being backed up and being unavailable when needed, maintenance of ICF catalogs to avoid costly downtime, and optimization of your environment with policy-based control over DASD allocation.
The webcast is a free event. Here is the URL to sign up:
http://www-01.ibm.com/software/os/systemz/telecon/19aug/index.html?S_TACT=100GV41M&S_CMP=5x5
Friday, August 6, 2010
OMEGAMON XE For IMS Transaction Reporting Facility overhead considerations
The Transaction Reporting Facility (TRF) component of OMEGAMON XE For IMS is used to create information needed for chargeback and IMS performance analysis. There can be overhead considerations when enabling Transaction Reporting Facility. The following APAR, OA33784, mentions overhead considerations when the DB2 collection option is enabled. Specifically, if the user is running BMPs, there will be additional TRF overhead for the DB2 collection portion, whether the BMP option is set to ON or OFF.
If you are running TRF you will want to take a look at this APAR:
http://www-01.ibm.com/support/docview.wss?uid=swg1OA33784&myns=swgtiv&mynp=OCSSXS8U&mync=R#more
If you are running TRF you will want to take a look at this APAR:
http://www-01.ibm.com/support/docview.wss?uid=swg1OA33784&myns=swgtiv&mynp=OCSSXS8U&mync=R#more
OMEGAMON currency maintenance for z/OS 1.12
OMEGAMON currency support for z/OS 1.12 is being provided for both OMEGAMON Versions 410, 420 as well as later releases of OMEGAMON XE products on z/OS.
To have currency for z/OS 1.12, you will need to be fairly current on maintenance. Also, there will be maintenance that applies to common code shared across multiple OMEGAMON tools.
For a link to information on the recommended maintenance for z/OS 1.12:
http://www-01.ibm.com/support/docview.wss?uid=swg21429049&myns=swgtiv&mynp=OCSSRJ25&mynp=OCSS8RV9&mynp=OCSSRMRD&mynp=OCSS2JNN&mynp=OCSS2JFP&mynp=OCSS2JL7&mync=R
Also, here is a link to a forum if you have questions: https://www.ibm.com/technologyconnect/pip/listforums.wss?linkid=1j3000
Wednesday, August 4, 2010
Situations and their impact on the cost of monitoring

Situations can have an impact on the resource usage of the OMEGAMON agent (TEMA) tasks.
Referring back to an earlier post, I mentioned the notion of the more I do, the more it will likely cost. The more data I request and the more data I store and/or act on, the will result often times be a higher cost of collection, and potentially greater overhead. The more alerts, the more information I alert on, the more rows of information I potentially alert on, and the larger the number of managed systems I alert on, the result will potentially be a higher cost of alerting. This cost of alerting will often be seen in places such as the TEMA address space.
To easily see how situation processing is impacting a managed system, from the Tivoli Portal you can right click on a managed system and select 'Manage Situations' (see the example). The pop-up that you get will show what situations are distributed to the managed system, plus some other very interesting information about the situations.
There is some very interesting information that this pop-up shows, as well. One column shows the interval that the situation executes on. The tighter the interval, the more work the TEMA has to do to handle the situation. Notice also, that there are several different intervals for the situation. Many of them are running on a 30 second interval, others on 1 minute, others on different intervals. One thing to be aware of is situation optimization. If you have multiple situations referencing the same table of information, the Tivoli infrastructure has the ability to optimize the situation checks, by doing one check versus multiple. However, this will work only if the situations are on the same interval.
Another apsect of situation optimization, is that if a situation that has 'Take Action', it is not eligible for this optimization. If you have many situations with 'Take Action', this will potentially significantly reduce the potential benefit of this function. One suggestion is, if you have a component such as OMNIBus, to consider using the EIF interface, versus 'Take Action' to drive alert notification. Using the EIF option will not inhibit situation optimization.
Friday, July 30, 2010
Learn more about zEnterprise
In August and September there will be a series of events covering the zEnterprise technology. The events are complimentary.
In the 1/2 day event you can get an overview of the new system, with all its hardware and software innovations. And you can find out how zEnterprise incorporates advanced industry and workload strategies to reduce your total cost of ownership/acquisition. You will be also able to put questions to IBM and industry experts from many areas, including zEnterprise, Business Intelligence and Tivoli.
Here is a list of cities and dates:
Minneapolis, MN August 17
Houston, TX August 19
Detroit, MI September 14
Montreal, QC September 14
Ottawa, ON September 15
Columbus, OH September 16
Hartford, CT September 16
Toronto, ON September 21
Jacksonville, FL September 21
Atlanta, GA September 22
Los Angeles, CA September 22
Here is a link to register (the price is right, the event is free):
https://www-950.ibm.com/events/wwe/grp/grp017.nsf/v16_events?openform&lp=systemzbriefings&locale=en_US
Wednesday, July 28, 2010
More efficient reporting in OMEGAMON DB2 PM/PE
This was an interesting issue that I helped a customer with recently in the area of OMEGAMON DB2 reporting.
The customer wanted to create a DB2 Accounting summary report, but just for a select plan, in this case DSNTEP2. Out of several million accounting records in SMF, there were, on a typical day, a few hundred relevant accounting records. When the customer ran the report, the batch job would run for almost 2 hours, and use a fair amount of CPU considering the amount of report data being generated. Even though the job was reading through several million accounting records to create the report, this seemed like an excessively long run time.
I reviewed the OMEGAMON DB2 reporter documentation (SC19-2510), and noted an entry that referred to the fact using the GLOBAL option would help reporter performance. The doc says: "Specify the filters in GLOBAL whenever you can, because only the data that passes through the GLOBAL filters is processed further. The less data OMEGAMON XE for DB2 PE needs to process, the better the performance."
So for example if all you want is a specific plan/authid try the following:
GLOBAL
INCLUDE (AUTHID (USERID01))
INCLUDE (PLANNAME (DSNTEP2)) .....
The net result for this user was that the run time for the same report dropped to just a few minutes, and CPU usage of the batch job dropped dramatically, as well. Take advantage of this option, when you can.
zEnterprise and Tivoli
The new zEnterprise systems are bigger, faster, better. More power and superior integration are important benefits of the technology.
So the question may be, where do IBM Tivoli solutions fit into this new computing capability? The short answer is that the Tivoli approach fits very well within this paradigm. One of the strengths of the Tivoli approach is integration and flexibility. The exsiting Tivoli suite of solutions (for example your OMEGAMON monitoring technology) will continue to run and provide value in this environment.
As details emerge, I will do more posts on how Tivoli will continue to exploit the new zEnterprise technology. Stay tuned.
Friday, July 23, 2010
About the new zEnterprise system
Yesterday was the announcement of the new zEnterprise system. Bigger, faster, better. That seems to be the bottom line.
Here are some of the specs from the IBM announcement page:
"At its core is the first model of the next generation System z, the zEnterprise 196 (z196). The industry’s fastest and most scalable enterprise system has 96 total cores running at an astonishing 5.2 GHz, and delivers up to 60% improvement in performance per core and up to 60% increase in total capacity."
Here is a link to the announcement:
http://www-03.ibm.com/systems/z/news/announcement/20100722_annc.html
Wednesday, July 21, 2010
Reminder - Upcoming webcasts tomorrow
Tomorrow, July 22nd, there will be two webcasts that you may find interesting.
The first is my webcast, "Top 10 Problem Solving Scenarios using IBM OMEGAMON and the Tivoli Enterprise Portal". This event is at 11 AM Eastern time. Here's a link to register and attend:
http://www.ibm.com/software/systemz/telecon/22jul
The second event is a major new technology announcement for System z. That event happens from 12 PM to 2 PM Eastern time. Here is a link for this event:
http://events.unisfair.com/rt/ibm~wos?code=614comm
Take advantage of RSS feeds to stay up to data

I was working with a customer recently, and we were talking about ways to stay current on what is happening in terms of issues and available fixes for their IBM Tivoli products.
IBM Tivoli support provides RSS feeds on all its relevant support pages. RSS feeds are a great way to keep track of what is happening, and it's easy to set up and use. All you need is a link to where the RSS feeds are, and a RSS reader (I use Google reader, it's free).
Here is a screen shot of one of the main RSS feeds pages. It has links for all the relevant IBM Tivoli products. Here is the URL for the page:
Thursday, July 15, 2010
Analyzing the CPU usage of OMEGAMON
OK. As I suggested last week, you look at your SMF data, or something comparable for a typical 24 hour period, and now you have an idea of which OMEGAMON address spaces use how much CPU. In general, you will find that some tasks will use more CPU resource than others. What's normal? As the saying goes, it depends. The next step is to get of list of how much the tasks use, and look for some patterns.
For example:
High CPU usage in the CUA and Classic task for a given OMEGAMON. Maybe an autorefresh user in CUA that is driving the Classic as well. Could also be OMEGAVIEW sampling at too frequent a rate, thereby driving the other tasks (check your OMEGAVIEW session definition).
CUA is low, but Classic interface is high. Now you can ignore autorefresh in CUA or OMEGAVIEW session definition. But, you still could have a user in Classic doing autorefresh (remember .VTM to check). This could be automation logging on to Classic to check for excpetions. This could also be history collection. Near term history in OMEGAMON DB2 and IMS have costs. Epilog in IMS has cost. Also, CICS task history (ONDV) can store a lot of information in a busy environment.
Classic and CUA are low, but TEMA (agent) tasks are high: Start looking at things like situations distributed to the various TEMAs. Look at the number of situations, the situation intervals, and are there a lot of situations with Take Actions.
TEMS is high: This could be many things. DASD collection. Enqueue collection. WLM collection. Sysplex proxy (if defined on this TEMS). Situation processing for the z/OS TEMA (which runs inside the TEMS on z/OS). Policy processing (if policies being used). Just to name a few things to check.
The above is not an exhaustive list, but it is a starting point in the analysis process. The best strategy is to determine certain tasks to focus on, and then begin your analysis there.
Wednesday, July 14, 2010
More on Autorefresh
I posted earlier on the costs of Autorefresh when over-using it in the Classic interface. Which then brings us to the question: how do you determine if someone is using Autorefresh, and what are they likely using as a refresh interval?
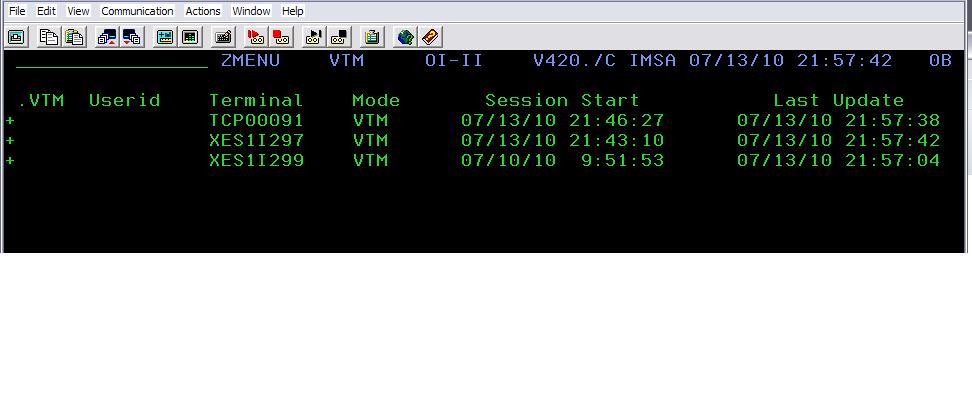
There is one very handy classic command that can tell you a lot about what is going on. The .VTM command will show information on sessions connected to the Classic task. Most important, it will show the last time the session was updated, either by the user hitting enter, or the screen being refreshed via Autorefresh.
Here is an example of the .VTM command in use. In the example you see three sessions. The middle session is my own session, and I can infer this because the Last Update time stamp matches the time on the top line of the screen. The bottom line is probably a session between OMEGAVIEW and OMEGAMON. The top line is the one of interest. If I refresh my screen a few times, I will see that the Last Update column for the session in question increments on a fairly regular basis. By watching that number you can infer that the top line is a session in Autorefresh mode, and what the interval is (in this example it is at the Classic default of 5 seconds).
Once you know that Autorefresh is being used, the next step is to locate the user in question, and ask them to either set the interval to a higher number, or to discontinue using Autorefresh mode.
Wednesday, July 7, 2010
Understanding the CPU usage of OMEGAMON
OMEGAMON installs as a set of started tasks on z/OS. Which started tasks get installed depends, of course, upon which OMEGAMONs from the suite you are running, and what features of OMEGAMON you may have configured. For example, if you are running OMEGAMON XE for DB2 or OMEGAMON XE for CICS, the agent task for the XE GUI interface (aka the TEMA), is something that you may or may not run, depending upon whether or not you use the Tivoli Portal GUI interface. The TEMA is not required if all you are doing is classic 3270 interface.
When you are looking at optimizing OMEGAMON, the first thing to understand is the CPU usage of each of the OMEGAMON address spaces. I suggest doing something like looking at SMF30 record output (or an equivalent), for each of the OMEGAMON started tasks, and generate a report that will let you see a summary of CPU usage by task. Look at the data for a selected 24 hour period, and look for patterns in the data. For example, first look for which tasks use the highest CPU of the various OMEGAMON tasks. Different installations may have different tasks that use more CPU, when compared to the other tasks. It really will depend upon what OMEGAMONs you have installed, and what you have configured. Once you have identified which OMEGAMON started tasks are using the most cycles relative to the other OMEGAMON tasks, that will provide a starting point for where to begin your analysis.
When you are looking at optimizing OMEGAMON, the first thing to understand is the CPU usage of each of the OMEGAMON address spaces. I suggest doing something like looking at SMF30 record output (or an equivalent), for each of the OMEGAMON started tasks, and generate a report that will let you see a summary of CPU usage by task. Look at the data for a selected 24 hour period, and look for patterns in the data. For example, first look for which tasks use the highest CPU of the various OMEGAMON tasks. Different installations may have different tasks that use more CPU, when compared to the other tasks. It really will depend upon what OMEGAMONs you have installed, and what you have configured. Once you have identified which OMEGAMON started tasks are using the most cycles relative to the other OMEGAMON tasks, that will provide a starting point for where to begin your analysis.
Wednesday, June 30, 2010
Looking at Autorefresh
We've discussed at length DASD monitoring considerations, and the cost of monitoring when it comes to DASD performance metric collection. What I would like to do next is take a look at other aspects of the cost of monitoring, and take into account such things as optimization of CPU required for monitoring.
One of the first things to look at when it comes to looking at the cost of monitoring is if you and your users are employing Autorefresh. Autorefresh implies that OMEGAMON will be regenerating a given monitoring display (screenspace, CUA screen, or TEP workspace) on a timed interval. In Classic and CUA interface, Autorefresh is set in the session options, and if used extensively, Autorefresh can measurably drive up the the CPU usage of the Classic and CUA tasks. For example, if you have multiple users, each running a display on a relatively tight (10 seconds or less) interval, OMEGAMON is doing a lot of work just painting and re-painting screens on a continuous basis.
The recommendations are as follows:
Limit the use of Autorefresh
If you must use Autorefresh, set it on a higher interval (60 seconds or higher)
Better yet, if you must use Autorefresh, us the Tivoli Portal to drive the display. The TEP has more options to control Autorefresh, and you will be moving some of the cost of screen rendering from the collection tasks to the TEP infrastructure.
Thursday, June 24, 2010
Webcast on System Automation V3.3
Sorry for the short notice, but there will be an interesting webcast on June 24th on "Achieving high availability and resiliency for your business with the new capabilities of Tivoli System Automation Version 3.3". If you can't make the event, you can always download and listen to the material later.
Here's the URL to register and attend:
http://www-01.ibm.com/software/os/systemz/telecon/24jun/index.html?S_TACT=100GV27M&S_CMP=5x5
Broadcast date/time: June 24, 2010, 11 a.m., EDT
The new Version 3.3 of Tivoli System Automation extends it's industry-leading capabilities through increased integration with Tivoli business management and monitoring solutions, additional automation controls, and simplification of automation activities.
In this session, the discussion will include how IBM Tivoli System Automation solutions can:
Provide remote management
Alerting and escalation as an adjunct to automation and high-availability solutions
Leverage automation technology for service management and business continuity
Speaker: Allison Ferguson, Automation Solutions Product Manager
Many thanks and keep stopping by....
Since January we've had over 1000 first time visitors to this blog. The traffic has been very good, and I appreciate all the interest.
I will continue to post technical content, and upcoming events. I have quite a bit more to cover just in the area of OMEGAMON optimization.
In the future I will be doing more to make this blog more interactive. Feel free to post comments. Also, if you have a topic of interest, please let me know. You can put it in a comment on this blog, or you can email me at woodse@us.ibm.com.
thanks again
Wednesday, June 23, 2010
Upcoming IBM webcast and virtual event
On July 22nd from 12 to 2 PM ET, IBM will be holding a virtual event on powerful new technology. Today's IT environments are built using diverse computing technologies x86, Unix, Linux, and z/OS. On July 22nd IBM will be unveiling a solution designed to integrate enterprise systems, people and processes - so they work together as one.
In the virtual event you will have the opportunity to:
- Be among the first to receive the latest technology breakthrough updates
- Network with your peers and IBM subject matter experts
- Participate in online discussions
- Download the latest whitepapers and brochures
- Meet the experts
- Live discussion with Q&A
To attend the virtual event go to the following URL:
http://events.unisfair.com/rt/ibm~wos?code=614comm
Friday, June 18, 2010
OMEGAMON Storage ICAT configuration considerations

When you are installing and configuring OMEGAMON XE For Storage there are quite a few options in the ICAT installation panels. Most of these options are fairly straight forward (such as sampling intervals for tape, cache control units, etc.). But, as I've mentioned in earlier posts, the most critical options revolve around the specification of the DASD collection options.
There are several options that control DASD collection, and there are some subtleties to the optimal way to specify collection. In the example shown here, Option 2 is where you can specify DASD collection frequency, and Option 3 is where you can specify devices to exclude from monitoring. If you can exclude some devices from ongoing monitoring, it may be a good idea to do so, and save the cost of monitoring.
Option 2 (DASD Device Monitoring) is the most critical panel to review. When you set up collection options here, you can either collect information every nth I/O (sample count) or collect when the device exceeds a specified MSR (millisecond response time) threshold. The example screen shot I show, has the default configuration panel. What you get by default is every I/O will be monitored, so my first recommendation is to not just automatically take the default. Take the time to configure the options on this panel.
First you can create an entry that will specify a VOLSER or device range. Once you have specified your devices, you then have a choice of monitoring I/O based on sampling (every n I/Os) or monitoring the device if a specified MSR threshold is exceeded. In the Monitor Status field, if you specify ON, then you will monitior based on the number specified in the Sample cnt/MSR field. But, if you enter MSR in the Monitoring Status option, I/O monitoring will happen if the device exceeds the MSR threshold. The Sample cnt/MSR field is treated as an MSR level setting, and the other part of the magic is that the MSR/exception trip count specified in the top portion of the panel comes into play.
Perhaps a little confusing, but obviously these options make a big difference in terms of how much data is gathered on an ongoing basis. If you want to keep the cost of collection down, then consider using the MSR option to collect when exceptions occur. If you want more data on an ongoing basis, then consider the sample approach, but set the sample frequency higher than the defualt of 1 (which means collect everything).
Wednesday, June 16, 2010
Upcoming Tivoli Enterprise Portal webcast
I will be doing a webcast next month on "Top 10 Problem Solving Scenarios using IBM OMEGAMON and the Tivoli Enterprise Portal". The presentation will look at what I consider to be one of the strengths of the Tivoli Portal, its power as a problem isolation and analysis tool. We will look at examples from all the core OMEGAMONs.
The webcast is July 22nd at 10 AM Eastern time. It's a free webcast, so the price is right. Here's a link to register and attend:
http://www.ibm.com/software/systemz/telecon/22jul
The webcast is July 22nd at 10 AM Eastern time. It's a free webcast, so the price is right. Here's a link to register and attend:
http://www.ibm.com/software/systemz/telecon/22jul
Monday, June 14, 2010
New OMEGAMON configuration methods
For years OMEGAMON users have installed and configured the product using an ISPF based dialog called ICAT. ICAT has been the primary mechanism to configure and manage all the core OMEGAMON tools (OMEGAMON for z/OS, CICS, DB2, IMS, Storage, Networks).
Over the past few months a new configuration method, called Parmlib, has been rolling out. Phase 2 of Parmlib support became available in May. Parmlib is intended to be an easier to use alternative to the ICAT process. In the June issue of IBM System z Advisor, Jeff Lowe has written an article that talks about Parmlib. If you are responsible for installation and configuration of OMEGAMON, you will find this article of interest.
Here is a link to the article:
http://www-01.ibm.com/software/tivoli/systemz-advisor/2010-06/config-for-omegamon.html
Friday, June 11, 2010
OMEGAMON Storage - Application level monitoring

OMEGAMON XE for Storage offers the flexibility to monitor DASD and I/O at the level of the application. What this means is that you can use the tool to focus your I/O monitoring strategy on the most critical applications, without having the need to monitor the entire DASD complex.
The example shown here shows how you can enable Application level monitoring. To enable application monitoring you need to create a situation to invoke collection. The primary parts of the situation are the application name (which can be wildcarded to include multiple tasks), the monitor switch (Y/N), and monitor I/O option (which controls if you want data set level monitoring). Given these options you have the flexibility to control what tasks you want to gather I/O information about, and whether you need data set level I/O detail.
The picture here shows an example of how to specify the situation to control application level monitoring.
Thursday, June 10, 2010
OMEGAMON Storage - User DASD Groups
OMEGAMON XE For Storage has many collection options for gathering DASD performance and space management information. User DASD groups are one option I find most interesting in that it gives the user considerable flexibility in terms of how DASD data is gathered and displayed. This flexibility is useful in terms of being able to control the cost of DASD monitoring.
A user DASD group is a user-defined logical grouping of DASD volumes related according to specific criteria. You can define a user DASD group based on volume name, device address, SMS storage group, or one or more aspects of the DASD device (examples include fragmentation index and MSR time). Once the user DASD group is defined, you can use the User DASD Group Performance and User DASD Group Space workspaces to view aggregated performance and space metrics for the group.
User DASD groups can be defined in a couple ways. One is via member hilev.RKANPARU(KDFDUDGI). The KDFDUDGI member allows for the definition of a group based on volume, a range of devices, or SMS storage group name.
Another way to create a user DASD group is via the Tivoli Portal (assuming V4.20 Interim Feature 2 is installed). In the TEP select the User DASD Groups Performance node on the navigation tree, right-click any row on the table view, and select Add Group from the menu. As before, the user may specify constraints by volume, device address, device range, SMS storage group, or volume attribute. There is also an attributes tab to specify the attribute constraints that are used in conjunction with the DASD device constraints specified. There is a drop-down list in the attribute column to specify the attribute information to be used.
I like user DASD groups because it provides a way to control monitoring options for various types of devices. Device architecture and usage varies in many enterprises. Being able to group devices makes the analysis more meaningful for a given environment.
Friday, June 4, 2010
Access System z from a Smart Phone
If your business is looking at exploiting technologies like the iPhone or the Droid, fear not, z/OS can work in this environment. Here is a link to an interesting IBM Red Book that goes into how it's possible to combine the traditional strengths of the mainframe to manage large volumes of data and run business transactions with the Web 2.0 paradigm. And to take advantage of simpler interfaces, better integration among different services, lightweight protocols for communication, and much more, together with the availability, security, and reliability of mainframe data.
Here is the link to the Red Book:
http://www.redbooks.ibm.com/Redbooks.nsf/RedbookAbstracts/sg247836.html?Open
Here is the link to the Red Book:
http://www.redbooks.ibm.com/Redbooks.nsf/RedbookAbstracts/sg247836.html?Open
Thursday, June 3, 2010
More on DASD monitoring - OMEGAMON XE For Storage
We've discussed DASD monitoring and the cost of monitoring for several of the OMEGAMON solutions. Now lets consider OMEGAMON XE For Storage, and the cost of monitoring considerations for this solution. As the name implies, OMEGAMON XE For Storage is an OMEGAMON solution focused on the monitoring of DASD on the z/OS platform. But, OMEGAMON Storage provides more than just DASD monitoring. OMEGAMON Storage also provides information on virtual tape, channels, control units, cache controllers, HSM activity, shared DASD, and even more. Another thing to be aware of is that OMEGAMON Storage has been evolving over the years, and has morphed into a much broader storage management, as well as a monitoring tool. OMEGAMON Storage now includes integration with a array of Tivoli Storage solutions, including HSM and backup tools, via the Tivoli Enterprise Portal.
Referring back to a primary consideration I mentioned in earlier posts, the more data you ask for, the more potential cost from a cost of monitoring perspective. OMEGAMON Storage certainly falls into this area. OMEGAMON Storage provides the ability to monitor storage at many different levels: shared DASD, the individual LPAR, the channel level, the controller level, the UCB level, even down to the individual dataset level. The user also has the ability to monitor DASD, I/O, and space utilization from the perspective of the workload applications on z/OS, and also to make user defined groups for monitoring and space analysis.
Clearly, OMEGAMON Storage provides useful and detailed information. It is important that the user have a well conceived plan when deploying OMEGAMON Storage to avoid redundant monitoring cost. When installing OMEGAMON Storage, the tool is usually installed on each LPAR in the z/OS environment. In a shared DASD environment, probably the first recommendation is to have the OMEGAMON Storage instance on a specified LPAR in the shared environment be the primary collection point for DASD information, thus avoiding redundant collection of DASD information on multiple LPARs.
There are quite a few more considerations for the set up and optimization of OMEGAMON Storage, and I will get into these in more detail in later posts.
Wednesday, May 26, 2010
Pulse Comes To You
Pulse is the annual IBM event that covers the wide array of Tivoli solutions. If you did not get a chance to go to Las Vegas to participate in Pulse, now you get a chance check out Pulse as part of Pulse Comes To You. Pulse Comes To You is a series of events at various locations all around the world, and provide you with a chance to learn more about systems management and IBM Tivoli solutions. Pulse Comes To You will be happening in a variety of cities in the next 2 months. For a list of locations, and how to sign up (it's free), here is a link for more information:
http://www-01.ibm.com/software/tivoli/pulse/pulsecomestoyou/2010/
http://www-01.ibm.com/software/tivoli/pulse/pulsecomestoyou/2010/
Tuesday, May 25, 2010
Upcoming webcast on mainframe network management
If you are interested in learning more about mainframe network management, there is an upcoming webcast on "Proactive problem determination and automation for IBM System z TCP/IP networks".
This is a free webcast sponsored by IBM that will help you learn how to better manage and optimize mainframe network throughput and technologies with IBM Tivoli System z network management solutions, and achieve the highest degree of mainframe network performance. You’ll come away with a better understanding of how IBM Tivoli can help you get the most out of System z networking components such as Enterprise Extender (EE), Open Systems Adapter (OSA) network controllers and TN3270 applications.
If you are interested, the webcast is June 3rd, at 11 AM ET. Here is a link to sign up for the event:
ibm.com/software/systemz/telecon/3jun
Monday, May 24, 2010
(You may not realize) NetView offers considerable TCP/IP management capabilities
I was having a discussion with colleagues last week, and the topic of NetView came up. It seems that many IBM customers do not realize that there is a considerable amount TCP/IP monitoring and management capabilities within the tool, along with the SNA functions that have been in the tool for many years. I've mentioned in earlier posts that I view NetView, as a complementary tool that works hand in hand with OMEGAMON XE For Mainframe Networks. Both tools provide considerable network management options, and both tools integrate via the Tivoli Enterprise Portal.
If you want a little more info on NetView, here is a link to a short YouTube video on the capabilities of NetView V5.4:
http://www.youtube.com/watch?v=go58kv5o88w
If you want a little more info on NetView, here is a link to a short YouTube video on the capabilities of NetView V5.4:
http://www.youtube.com/watch?v=go58kv5o88w
Friday, May 21, 2010
DASD monitoring considerations for OMEGAMON IMS
So far I've talked about the "Big Three" (z/OS, CICS, DB2). Now, I will start to address the DASD and I/O monitoring considerations for some of the other OMEGAMON tools.
OMEGAMON XE for IMS provides DASD and I/O related information in several different areas. In the real time 3270 displays, OMEGAMON IMS provides IMS database I/O rates, IMS Log I/O rate info, Long and Short Message Queue rate info, Fast Path Database I/O info, plus information on the various OSAM and VSAM database buffer pools. This information is often useful from a diagnostic and tuning standpoint, and there are no real overhead concerns in terms of collecting the data.
There are a couple areas where DASD, I/O, and I/O related information can impact the cost of monitoring. One area is Bottleneck Analysis. Bottleneck Analysis is a very useful and powerful analysis tool for understanding where IMS workload is spending it's time. One of the sub-options of Bottleneck Analysis is a database switch (DBSW option). If you have Bottleneck Analysis ON, but the database switch option OFF, you will save some CPU in the OMEGAMON IMS collector task. Another consideration is Epilog history. Epilog does a nice job of gathering historical performance analysis information, but you can save some cost of collection by turning off DASD collection in the Epilog history options. This is done by specifying the NORESC(DAS,DEV) option.
Probably the biggie, related to database and I/O monitoring in OMEGAMON IMS is the Transaction Reporting Facility (TRF). If TRF is enabled, OMEGAMON IMS will typically generate records on transaction and database activity into the IMS log. This data is often useful for performance analysis and charge back, but it is potentially voluminous. If you turn it on, be aware of the options for TRF, and recognize that there will be costs in terms of additional CPU usage by the OMEGAMON collector task, and more data written to the IMS log files.
Wednesday, May 19, 2010
DASD Considerations for OMEGAMON DB2
So far we've discussed DASD monitoring considerations for OMEGAMON z/OS and OMEGAMON CICS. Now let's consider OMEGAMON DB2.
There are multiple aspects to consider when we are talking about OMEGAMON DB2. OMEGAMON DB2 collects DASD relevant data for such things as DB2 log I/O, EDM pool I/O information, and object I/O data when doing drill down analysis of virtual pool statistics. This information is provided essentially out of the box, and does not have major overhead considerations.
There are some areas where DASD and I/O monitoring can add overhead, and you do have the ability to control if the data collection is on or off. The first major facility is Object Analysis. Object Analysis is an I/O and getpage analysis facility that will look at all the I/O and getpage activity being done on the subsystem, and correlate that getpage and I/O activity by object, and by DB2 thread. Object Analysis does have an ongoing cost of collection. It does not use DB2 traces, but if the Object Analysis collector is allowed to run all the time, it will add to the CPU usage of the OMEGAMON DB2 collector task. In some shops this is not a big issue, in other (usually larger) shops, it is a consideration. You can optionally configure Object Analysis so that it is off by default, but you may start it, as needed. This is a good strategy for those who want to reduce the cost of monitoring, but still have access to the data when needed. I had an earlier post that describes how to configure Object Analysis to achieve this. Another option to consider with Object Analysis is the thread correlation option. If this is enabled, Object Analysis will use more resource, but I find the thread data to be quite useful.
For those DB2 data sharing users, there is another option to consider, Group Object Analysis. If Group Object Analysis is enabled, that means you are running Object Analysis at the level of each DB2 subsystem (i.e. member) within the data sharing group. That means you have the ongoing cost of running Object Analysis at that level, plus you also have the cost at the level of the OMEGAMON DB2 agent task of correlating the data, in particular if thread correlation is enabled. Group Object Analysis is useful data for a data sharing shop, but understand that you will be pulling potentially a fair amount of data on an ongoing basis.
Now let's consider history. In addition to the Accounting and Statistics trace options in the Near Term History setup options, you also have the option to enable such things as SQL, Sort, and Scan data collection. My recommendation, in general, is to set the Scan option to off. The data will give you an indication of some aspects of scan activity done by the thread, but be advised this data is collected via DB2 IFCID traces, and may add more cost to running Near Term History.
Thursday, May 13, 2010
OMEGAMON Currency Support for z/OS 1.11
If you are looking at going to z/OS V1.11, here is some information on recommended maintenance for OMEGAMON V4.1 and OMEGAMON V4.2. Follow the link for more information:
http://www-01.ibm.com/support/docview.wss?uid=swg21382493
http://www-01.ibm.com/support/docview.wss?uid=swg21382493
Tuesday, May 11, 2010
Windows on System z
I had heard a bit about this a while back. Supposedly there was a Share presentation in 2009 that mentioned the feasibility of this. Apparently, there is now an appliance that will allow you to run Windows on System z hardware, in a similar manner to how you run Linux on z. I'm not sure yet of its potential, but it sounds interesting, to say the least.
Here is a link to an article on this:
http://www.mainframezone.com/it-management/windows-and-other-x86-operating-systems-on-system-z
Here is a link to an article on this:
http://www.mainframezone.com/it-management/windows-and-other-x86-operating-systems-on-system-z
Thursday, May 6, 2010
More on DASD monitoring with OMEGAMON z/OS

In earlier posts I've talked about the cost of DASD monitoring, and the notion of the more data you ask for, the more it will potentially cost. This concept can apply, as well, when using the OMEGAMON z/OS CUA and Classic interfaces when monitoring DASD.
It's not unusual for large shops to have thousands of DASD devices connected in their environment. What that means is if you do a lot of ongoing monitoring of these thousands of devices, there is the potential for more OMEGAMON cycle usage to gather and display all this data.
One way to reduce this concern is to take advantage of filter options when displaying DASD devices. Do you really need to see every device, or just ones that meet certain criteria, such as high MSR (milli-second response) times, or high I/O rates? Some basic benchmark testing I've done on IBM systems, have shown measurable OMEGAMON CPU savings by using filter options to reduce the amount of data a devices displayed. This is especially true if you, like many users, like to display DASD devices and watch them in auto-update mode.
The example I show here is an example of using the filter options of the CUA interface to focus on the DASD devices of most interest. You can do a similar technique in the Classic 3270 interface.
Wednesday, May 5, 2010
Managing Workload on Linux on System z seminars
If you are interested in learning more about Linux on System z, there are series of upcoming seminars on the topic. "Managing Mission-Critical Workload on Linux on System z" is a free technology update to learn through case studies how IBM and its Business Partners are implementing virtualized enterprises using Linux on System z.
Some of the objectives of the seminar inlcude understanding how to increase system utilization to avoid investing in and powering unneeded hardware, how to give technical, management and business teams relevant views of the data they need, and how to investigate performance of all mainframe and distributed systems.
Dates and locations are as follows:
Dallas, May 11
https://www-950.ibm.com/events/wwe/grp/grp004.nsf/v16_agenda?openform&seminar=QAFNJTES&locale=en_US
Minneapolis, May 18
https://www-950.ibm.com/events/wwe/grp/grp004.nsf/v16_agenda?openform&seminar=Q72PMKES&locale=en_US
Atlanta, May 20
https://www-950.ibm.com/events/wwe/grp/grp004.nsf/v16_agenda?openform&seminar=F86QRFES&locale=en_US
Houston, May 25
https://www-950.ibm.com/events/wwe/grp/grp004.nsf/v16_agenda?openform&seminar=62BRBDES&locale=en_US
NYC, June 1
https://www-950.ibm.com/events/wwe/grp/grp004.nsf/v16_agenda?openform&seminar=4ZEAU5ES&locale=en_US
Boston, July 7
https://www-950.ibm.com/events/wwe/grp/grp004.nsf/v16_agenda?openform&seminar=296A58ES&locale=en_US
Friday, April 23, 2010
Upcoming System z technology summits
Another round of System z technology summits will be happening in the next few weeks. The System z technology summit is a nice event with multiple tracks on System z, Database, Application development, and of course Systems Management. There is a lot of good technical content (meaning not just marketing fluff). Upcoming cities include Columbus, Costa Mesa, and San Francisco. I will be presenting "Leveraging The Tivoli Enterprise Portal" at the event in Columbus.
If you are interested, we would love to have you attend. Here are the dates, places, and links to sign up for the events:
Columbus, OH - May 11 - www.ibm.com/events/software/systemz/seminar/TechSum1
Costa Mesa, CA - June 16 - www.ibm.com/events/software/systemz/seminar/TechSum3
San Francisco, CA - May 13 - www.ibm.com/events/software/systemz/seminar/TechSum2
Subscribe to:
Posts (Atom)

