
On September 30, 2010 at 11 AM, Eastern time, there will be a webcast titled "Tivoli NetView for z/OS in zEnterprise".
In this complimentary teleconference you can learn how IBM Tivoli NetView for z/OS addresses critical issues, including complexity, by providing the foundation for consolidating and integrating key service management processes in your zEnterprise environment. You’ll see how Tivoli’s NetView for z/OS-based integrated solutions can help you deliver value by improving the availability and resiliency of zEnterprise systems and applications, reduce the need for operator intervention, and fine-tune service delivery. With less unplanned downtime, there’s less impact on your business.
The speakers are Mark Edwards, Senior Product Manager, IBM Software Group and Larry Green, NetView for z/OS Architect, IBM Software Group.
Here is a link to sign up for the event:
http://www.ibm.com/software/os/systemz/telecon/30sep/index.html?S_TACT=100GV43M&S_CMP=5x5
Monday, August 30, 2010


Thursday, August 26, 2010
Leveraging the Situation Console

The Situation Event Console will show the situations open in a given monitoring environment, and provide drill downs for details on the situation alert. By default, the Situation Console is provided for the entire enterprise on the product provided Enterprise workspace.
What's nice is you can implicitly filter and optimize the Situation Event Console for your specific requirements, and the types of alerts you need to see. In this example I made a change to the product provided DB2 Messages workspace. I split the top DB2 message window, and then did a click and drag from the tool bar, and dropped the Situation Event Console icon on the DB2 workspace I'm editing. The result is now I have a Situation Event Console filtered for just DB2 alerts. You can do the same thing, for other managed system types, as well. This technique is an easy way to tune out the noise, and target the information you are most interested in when it comes to situation alerts.
Tuesday, August 24, 2010
OMEGAMON DB2 Messages Workspace

OMEGAMON DB2 V4.1 added support for DB2 message logging and management to the Tivoli Portal as an interim feature. The DB2 message feature has some interesting and useful capabilities, such as highlighting application failure/abend messages and tracking Deadlock/timeout/escalation messages. The default workspace will show the last 10 messages, and will highlight typical problem messages. But, as with any Tivoli Portal workspace, you can easily customize the workspace to your specific requirements.
Another nice usage of the DB2 Messages workspace is the ability to create situations based upon DB2 messages. In the example I show here I created an alert based upon a DSNL027I message. Notice also that you can take advantage of the ability to highlight information, such as for the DSN3201I error message.
If you want to try out the DB2 Messages feature, but do not see any messages appearing in the workspace, check on the following command:
F cccccccc,F PESERVER,F db2ssid,DB2MSGMON=Y
where ccccccc is the OM DB2 collector task, DB2 ID would be the DB2 you want to collect messages from.
The above modify will enable message collection to occur, and you should be able to see data in the workspace.
Friday, August 20, 2010
About Policies

Policies are an interesting and powerful feature of the Tivoli Enterprise Portal. Common usages of policies include such things as enabling a situation to issue multiple commands when true, stopping and starting situations as needed, and using multiple checks and command options with a single command flow. Policies provide a way to expand the command capabilities of the Tivoli Portal.
There are some things to consider when using policies. First, be aware that situations that are embedded within the policy logic are 'copies' of the original situation. In other words, if you take a commonly used situation and embed it within a policy, that situation logic will be run twice, once for the situation itself, and once for the policy. That, in and of itself, may not be a problem. But, be aware that if you are using a higher cost situation in a policy, you will be using that higher cost situation twice. Second, situations usually run within the agent task, but policies run within the TEMS infrastructure. Third, similar to the interval concept of situations, policies also have an inherent loop execution logic.
To know if any policies are connected to a given managed system, you can right click on the managed system within the Tivoli Portal and select 'Manage policies' to see what policies have been deployed.
Monday, August 16, 2010
Upcoming webcast on OMEGAMON installation and troubleshooting
On September 14th there will be a webcast on "IBM Tivoli OMEGAMON® XE for z/OS from Installation to Troubleshooting – PART1". This webcast will cover the following:
Omegamon XE for zOS:Installation and Configuration
Omegamon XE for zOS:Usage
Omegamon XE for zOS:Troubleshooting
Here is a link for more information on the event:
http://www-01.ibm.com/support/docview.wss?uid=swg27019462&myns=swgtiv&mynp=OCSS2JNN&mync=R
Omegamon XE for zOS:Installation and Configuration
Omegamon XE for zOS:Usage
Omegamon XE for zOS:Troubleshooting
Here is a link for more information on the event:
http://www-01.ibm.com/support/docview.wss?uid=swg27019462&myns=swgtiv&mynp=OCSS2JNN&mync=R
Friday, August 13, 2010
More on OMEGAMON z/OS currency maintenance
While browsing through my Google reader I noticed an entry titiled "ABENDs after upgrading level of z/OS". The symptom is various ABENDs (i.e. S0C1, S0C4, U0012, U1213, etc.) in the TEMS or in any of the OMEGAMON agents after upgrading your level of z/OS.
The bottom line is when you upgrade your level of z/OS, you need to be sure to apply OMEGAMON Currency PTFs to support that new level of z/OS, AND (let's not forget the AND) OMEGAMON Currency PTFs for any level of z/OS you skipped over. If you skip a level of z/OS (i.e. upgrade from z/OS 1.9 to z/OS 1.11), you need to apply the OMEGAMON Currency PTFs for the level(s) you skipped as well as the level to which you upgraded.
Here is a link to the document, and the document in turn includes links to recommended maintenance levels for z/OS 1.10, 1.11, and 1.12.
http://www-01.ibm.com/support/docview.wss?uid=swg21439161&myns=swgtiv&mynp=OCSS2JNN&mync=R
The bottom line is when you upgrade your level of z/OS, you need to be sure to apply OMEGAMON Currency PTFs to support that new level of z/OS, AND (let's not forget the AND) OMEGAMON Currency PTFs for any level of z/OS you skipped over. If you skip a level of z/OS (i.e. upgrade from z/OS 1.9 to z/OS 1.11), you need to apply the OMEGAMON Currency PTFs for the level(s) you skipped as well as the level to which you upgraded.
Here is a link to the document, and the document in turn includes links to recommended maintenance levels for z/OS 1.10, 1.11, and 1.12.
http://www-01.ibm.com/support/docview.wss?uid=swg21439161&myns=swgtiv&mynp=OCSS2JNN&mync=R
Thursday, August 12, 2010
Using ITMSUPER to understand the cost of situation processing

ITMSUPER is an excellent tool that can provide tremendous insight into what is happening in the IBM Tivoli monitoring infrastructure. ITMSUPER is available from the OPAL web site (see the link to OPAL on the right of this page). OPAL is a good source of handy tools and other goodies. ITMSUPER is one of the most useful.
There are many uses for ITMSUPER, analyzing situation processing is just one. In the example I show some of the typical output from ITMSUPER. I clicked on the line in the middle of the display "Cost of running situations". This display shows information on what situations are running within the given agent (TEMA) task. Note that the display also provides information on the situation interval, number of rows processed for the situation, and a relative cost of running the situation per hour. This is very good information to use to determine which situations are potentially more costly to run than others.
Monday, August 9, 2010
Upcoming webcast on z/OS storage management
On August 19th there will be a webcast on "IBM Tivoli System z Storage Management update: An integrated toolset for better insight, analysis and control".
This event will cover the IBM Tivoli storage management suite of solutions. In this session, examples to be discussed will include: how to pinpoint a critical address space not performing well and in real time and identify all the data sets and devices that the address space is using, reveal hidden errors in HSM control data sets that can result in data not being backed up and being unavailable when needed, maintenance of ICF catalogs to avoid costly downtime, and optimization of your environment with policy-based control over DASD allocation.
The webcast is a free event. Here is the URL to sign up:
http://www-01.ibm.com/software/os/systemz/telecon/19aug/index.html?S_TACT=100GV41M&S_CMP=5x5
This event will cover the IBM Tivoli storage management suite of solutions. In this session, examples to be discussed will include: how to pinpoint a critical address space not performing well and in real time and identify all the data sets and devices that the address space is using, reveal hidden errors in HSM control data sets that can result in data not being backed up and being unavailable when needed, maintenance of ICF catalogs to avoid costly downtime, and optimization of your environment with policy-based control over DASD allocation.
The webcast is a free event. Here is the URL to sign up:
http://www-01.ibm.com/software/os/systemz/telecon/19aug/index.html?S_TACT=100GV41M&S_CMP=5x5
Friday, August 6, 2010
OMEGAMON XE For IMS Transaction Reporting Facility overhead considerations
The Transaction Reporting Facility (TRF) component of OMEGAMON XE For IMS is used to create information needed for chargeback and IMS performance analysis. There can be overhead considerations when enabling Transaction Reporting Facility. The following APAR, OA33784, mentions overhead considerations when the DB2 collection option is enabled. Specifically, if the user is running BMPs, there will be additional TRF overhead for the DB2 collection portion, whether the BMP option is set to ON or OFF.
If you are running TRF you will want to take a look at this APAR:
http://www-01.ibm.com/support/docview.wss?uid=swg1OA33784&myns=swgtiv&mynp=OCSSXS8U&mync=R#more
If you are running TRF you will want to take a look at this APAR:
http://www-01.ibm.com/support/docview.wss?uid=swg1OA33784&myns=swgtiv&mynp=OCSSXS8U&mync=R#more
OMEGAMON currency maintenance for z/OS 1.12
OMEGAMON currency support for z/OS 1.12 is being provided for both OMEGAMON Versions 410, 420 as well as later releases of OMEGAMON XE products on z/OS.
To have currency for z/OS 1.12, you will need to be fairly current on maintenance. Also, there will be maintenance that applies to common code shared across multiple OMEGAMON tools.
For a link to information on the recommended maintenance for z/OS 1.12:
http://www-01.ibm.com/support/docview.wss?uid=swg21429049&myns=swgtiv&mynp=OCSSRJ25&mynp=OCSS8RV9&mynp=OCSSRMRD&mynp=OCSS2JNN&mynp=OCSS2JFP&mynp=OCSS2JL7&mync=R
Also, here is a link to a forum if you have questions: https://www.ibm.com/technologyconnect/pip/listforums.wss?linkid=1j3000
To have currency for z/OS 1.12, you will need to be fairly current on maintenance. Also, there will be maintenance that applies to common code shared across multiple OMEGAMON tools.
For a link to information on the recommended maintenance for z/OS 1.12:
http://www-01.ibm.com/support/docview.wss?uid=swg21429049&myns=swgtiv&mynp=OCSSRJ25&mynp=OCSS8RV9&mynp=OCSSRMRD&mynp=OCSS2JNN&mynp=OCSS2JFP&mynp=OCSS2JL7&mync=R
Also, here is a link to a forum if you have questions: https://www.ibm.com/technologyconnect/pip/listforums.wss?linkid=1j3000
Wednesday, August 4, 2010
Situations and their impact on the cost of monitoring

Situations can have an impact on the resource usage of the OMEGAMON agent (TEMA) tasks.
Referring back to an earlier post, I mentioned the notion of the more I do, the more it will likely cost. The more data I request and the more data I store and/or act on, the will result often times be a higher cost of collection, and potentially greater overhead. The more alerts, the more information I alert on, the more rows of information I potentially alert on, and the larger the number of managed systems I alert on, the result will potentially be a higher cost of alerting. This cost of alerting will often be seen in places such as the TEMA address space.
To easily see how situation processing is impacting a managed system, from the Tivoli Portal you can right click on a managed system and select 'Manage Situations' (see the example). The pop-up that you get will show what situations are distributed to the managed system, plus some other very interesting information about the situations.
There is some very interesting information that this pop-up shows, as well. One column shows the interval that the situation executes on. The tighter the interval, the more work the TEMA has to do to handle the situation. Notice also, that there are several different intervals for the situation. Many of them are running on a 30 second interval, others on 1 minute, others on different intervals. One thing to be aware of is situation optimization. If you have multiple situations referencing the same table of information, the Tivoli infrastructure has the ability to optimize the situation checks, by doing one check versus multiple. However, this will work only if the situations are on the same interval.
Another apsect of situation optimization, is that if a situation that has 'Take Action', it is not eligible for this optimization. If you have many situations with 'Take Action', this will potentially significantly reduce the potential benefit of this function. One suggestion is, if you have a component such as OMNIBus, to consider using the EIF interface, versus 'Take Action' to drive alert notification. Using the EIF option will not inhibit situation optimization.
Friday, July 30, 2010
Learn more about zEnterprise
In August and September there will be a series of events covering the zEnterprise technology. The events are complimentary.
In the 1/2 day event you can get an overview of the new system, with all its hardware and software innovations. And you can find out how zEnterprise incorporates advanced industry and workload strategies to reduce your total cost of ownership/acquisition. You will be also able to put questions to IBM and industry experts from many areas, including zEnterprise, Business Intelligence and Tivoli.
Here is a list of cities and dates:
Minneapolis, MN August 17
Houston, TX August 19
Detroit, MI September 14
Montreal, QC September 14
Ottawa, ON September 15
Columbus, OH September 16
Hartford, CT September 16
Toronto, ON September 21
Jacksonville, FL September 21
Atlanta, GA September 22
Los Angeles, CA September 22
Here is a link to register (the price is right, the event is free):
https://www-950.ibm.com/events/wwe/grp/grp017.nsf/v16_events?openform&lp=systemzbriefings&locale=en_US
In the 1/2 day event you can get an overview of the new system, with all its hardware and software innovations. And you can find out how zEnterprise incorporates advanced industry and workload strategies to reduce your total cost of ownership/acquisition. You will be also able to put questions to IBM and industry experts from many areas, including zEnterprise, Business Intelligence and Tivoli.
Here is a list of cities and dates:
Minneapolis, MN August 17
Houston, TX August 19
Detroit, MI September 14
Montreal, QC September 14
Ottawa, ON September 15
Columbus, OH September 16
Hartford, CT September 16
Toronto, ON September 21
Jacksonville, FL September 21
Atlanta, GA September 22
Los Angeles, CA September 22
Here is a link to register (the price is right, the event is free):
https://www-950.ibm.com/events/wwe/grp/grp017.nsf/v16_events?openform&lp=systemzbriefings&locale=en_US
Wednesday, July 28, 2010
More efficient reporting in OMEGAMON DB2 PM/PE
This was an interesting issue that I helped a customer with recently in the area of OMEGAMON DB2 reporting.
The customer wanted to create a DB2 Accounting summary report, but just for a select plan, in this case DSNTEP2. Out of several million accounting records in SMF, there were, on a typical day, a few hundred relevant accounting records. When the customer ran the report, the batch job would run for almost 2 hours, and use a fair amount of CPU considering the amount of report data being generated. Even though the job was reading through several million accounting records to create the report, this seemed like an excessively long run time.
I reviewed the OMEGAMON DB2 reporter documentation (SC19-2510), and noted an entry that referred to the fact using the GLOBAL option would help reporter performance. The doc says: "Specify the filters in GLOBAL whenever you can, because only the data that passes through the GLOBAL filters is processed further. The less data OMEGAMON XE for DB2 PE needs to process, the better the performance."
So for example if all you want is a specific plan/authid try the following:
GLOBAL
INCLUDE (AUTHID (USERID01))
INCLUDE (PLANNAME (DSNTEP2)) .....
The net result for this user was that the run time for the same report dropped to just a few minutes, and CPU usage of the batch job dropped dramatically, as well. Take advantage of this option, when you can.
The customer wanted to create a DB2 Accounting summary report, but just for a select plan, in this case DSNTEP2. Out of several million accounting records in SMF, there were, on a typical day, a few hundred relevant accounting records. When the customer ran the report, the batch job would run for almost 2 hours, and use a fair amount of CPU considering the amount of report data being generated. Even though the job was reading through several million accounting records to create the report, this seemed like an excessively long run time.
I reviewed the OMEGAMON DB2 reporter documentation (SC19-2510), and noted an entry that referred to the fact using the GLOBAL option would help reporter performance. The doc says: "Specify the filters in GLOBAL whenever you can, because only the data that passes through the GLOBAL filters is processed further. The less data OMEGAMON XE for DB2 PE needs to process, the better the performance."
So for example if all you want is a specific plan/authid try the following:
GLOBAL
INCLUDE (AUTHID (USERID01))
INCLUDE (PLANNAME (DSNTEP2)) .....
The net result for this user was that the run time for the same report dropped to just a few minutes, and CPU usage of the batch job dropped dramatically, as well. Take advantage of this option, when you can.
zEnterprise and Tivoli
The new zEnterprise systems are bigger, faster, better. More power and superior integration are important benefits of the technology.
So the question may be, where do IBM Tivoli solutions fit into this new computing capability? The short answer is that the Tivoli approach fits very well within this paradigm. One of the strengths of the Tivoli approach is integration and flexibility. The exsiting Tivoli suite of solutions (for example your OMEGAMON monitoring technology) will continue to run and provide value in this environment.
As details emerge, I will do more posts on how Tivoli will continue to exploit the new zEnterprise technology. Stay tuned.
So the question may be, where do IBM Tivoli solutions fit into this new computing capability? The short answer is that the Tivoli approach fits very well within this paradigm. One of the strengths of the Tivoli approach is integration and flexibility. The exsiting Tivoli suite of solutions (for example your OMEGAMON monitoring technology) will continue to run and provide value in this environment.
As details emerge, I will do more posts on how Tivoli will continue to exploit the new zEnterprise technology. Stay tuned.
Friday, July 23, 2010
About the new zEnterprise system
Yesterday was the announcement of the new zEnterprise system. Bigger, faster, better. That seems to be the bottom line.
Here are some of the specs from the IBM announcement page:
"At its core is the first model of the next generation System z, the zEnterprise 196 (z196). The industry’s fastest and most scalable enterprise system has 96 total cores running at an astonishing 5.2 GHz, and delivers up to 60% improvement in performance per core and up to 60% increase in total capacity."
Here is a link to the announcement:
http://www-03.ibm.com/systems/z/news/announcement/20100722_annc.html
Here are some of the specs from the IBM announcement page:
"At its core is the first model of the next generation System z, the zEnterprise 196 (z196). The industry’s fastest and most scalable enterprise system has 96 total cores running at an astonishing 5.2 GHz, and delivers up to 60% improvement in performance per core and up to 60% increase in total capacity."
Here is a link to the announcement:
http://www-03.ibm.com/systems/z/news/announcement/20100722_annc.html
Wednesday, July 21, 2010
Reminder - Upcoming webcasts tomorrow
Tomorrow, July 22nd, there will be two webcasts that you may find interesting.
The first is my webcast, "Top 10 Problem Solving Scenarios using IBM OMEGAMON and the Tivoli Enterprise Portal". This event is at 11 AM Eastern time. Here's a link to register and attend:
http://www.ibm.com/software/systemz/telecon/22jul
The second event is a major new technology announcement for System z. That event happens from 12 PM to 2 PM Eastern time. Here is a link for this event:
http://events.unisfair.com/rt/ibm~wos?code=614comm
The first is my webcast, "Top 10 Problem Solving Scenarios using IBM OMEGAMON and the Tivoli Enterprise Portal". This event is at 11 AM Eastern time. Here's a link to register and attend:
http://www.ibm.com/software/systemz/telecon/22jul
The second event is a major new technology announcement for System z. That event happens from 12 PM to 2 PM Eastern time. Here is a link for this event:
http://events.unisfair.com/rt/ibm~wos?code=614comm
Take advantage of RSS feeds to stay up to data

I was working with a customer recently, and we were talking about ways to stay current on what is happening in terms of issues and available fixes for their IBM Tivoli products.
IBM Tivoli support provides RSS feeds on all its relevant support pages. RSS feeds are a great way to keep track of what is happening, and it's easy to set up and use. All you need is a link to where the RSS feeds are, and a RSS reader (I use Google reader, it's free).
Here is a screen shot of one of the main RSS feeds pages. It has links for all the relevant IBM Tivoli products. Here is the URL for the page:
Thursday, July 15, 2010
Analyzing the CPU usage of OMEGAMON
OK. As I suggested last week, you look at your SMF data, or something comparable for a typical 24 hour period, and now you have an idea of which OMEGAMON address spaces use how much CPU. In general, you will find that some tasks will use more CPU resource than others. What's normal? As the saying goes, it depends. The next step is to get of list of how much the tasks use, and look for some patterns.
For example:
High CPU usage in the CUA and Classic task for a given OMEGAMON. Maybe an autorefresh user in CUA that is driving the Classic as well. Could also be OMEGAVIEW sampling at too frequent a rate, thereby driving the other tasks (check your OMEGAVIEW session definition).
CUA is low, but Classic interface is high. Now you can ignore autorefresh in CUA or OMEGAVIEW session definition. But, you still could have a user in Classic doing autorefresh (remember .VTM to check). This could be automation logging on to Classic to check for excpetions. This could also be history collection. Near term history in OMEGAMON DB2 and IMS have costs. Epilog in IMS has cost. Also, CICS task history (ONDV) can store a lot of information in a busy environment.
Classic and CUA are low, but TEMA (agent) tasks are high: Start looking at things like situations distributed to the various TEMAs. Look at the number of situations, the situation intervals, and are there a lot of situations with Take Actions.
TEMS is high: This could be many things. DASD collection. Enqueue collection. WLM collection. Sysplex proxy (if defined on this TEMS). Situation processing for the z/OS TEMA (which runs inside the TEMS on z/OS). Policy processing (if policies being used). Just to name a few things to check.
The above is not an exhaustive list, but it is a starting point in the analysis process. The best strategy is to determine certain tasks to focus on, and then begin your analysis there.
For example:
High CPU usage in the CUA and Classic task for a given OMEGAMON. Maybe an autorefresh user in CUA that is driving the Classic as well. Could also be OMEGAVIEW sampling at too frequent a rate, thereby driving the other tasks (check your OMEGAVIEW session definition).
CUA is low, but Classic interface is high. Now you can ignore autorefresh in CUA or OMEGAVIEW session definition. But, you still could have a user in Classic doing autorefresh (remember .VTM to check). This could be automation logging on to Classic to check for excpetions. This could also be history collection. Near term history in OMEGAMON DB2 and IMS have costs. Epilog in IMS has cost. Also, CICS task history (ONDV) can store a lot of information in a busy environment.
Classic and CUA are low, but TEMA (agent) tasks are high: Start looking at things like situations distributed to the various TEMAs. Look at the number of situations, the situation intervals, and are there a lot of situations with Take Actions.
TEMS is high: This could be many things. DASD collection. Enqueue collection. WLM collection. Sysplex proxy (if defined on this TEMS). Situation processing for the z/OS TEMA (which runs inside the TEMS on z/OS). Policy processing (if policies being used). Just to name a few things to check.
The above is not an exhaustive list, but it is a starting point in the analysis process. The best strategy is to determine certain tasks to focus on, and then begin your analysis there.
Wednesday, July 14, 2010
More on Autorefresh
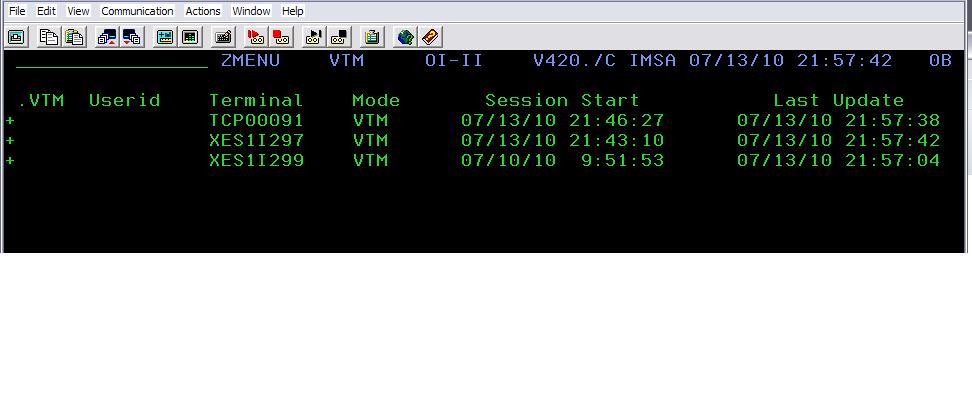
I posted earlier on the costs of Autorefresh when over-using it in the Classic interface. Which then brings us to the question: how do you determine if someone is using Autorefresh, and what are they likely using as a refresh interval?
There is one very handy classic command that can tell you a lot about what is going on. The .VTM command will show information on sessions connected to the Classic task. Most important, it will show the last time the session was updated, either by the user hitting enter, or the screen being refreshed via Autorefresh.
Here is an example of the .VTM command in use. In the example you see three sessions. The middle session is my own session, and I can infer this because the Last Update time stamp matches the time on the top line of the screen. The bottom line is probably a session between OMEGAVIEW and OMEGAMON. The top line is the one of interest. If I refresh my screen a few times, I will see that the Last Update column for the session in question increments on a fairly regular basis. By watching that number you can infer that the top line is a session in Autorefresh mode, and what the interval is (in this example it is at the Classic default of 5 seconds).
Once you know that Autorefresh is being used, the next step is to locate the user in question, and ask them to either set the interval to a higher number, or to discontinue using Autorefresh mode.
Wednesday, July 7, 2010
Understanding the CPU usage of OMEGAMON
OMEGAMON installs as a set of started tasks on z/OS. Which started tasks get installed depends, of course, upon which OMEGAMONs from the suite you are running, and what features of OMEGAMON you may have configured. For example, if you are running OMEGAMON XE for DB2 or OMEGAMON XE for CICS, the agent task for the XE GUI interface (aka the TEMA), is something that you may or may not run, depending upon whether or not you use the Tivoli Portal GUI interface. The TEMA is not required if all you are doing is classic 3270 interface.
When you are looking at optimizing OMEGAMON, the first thing to understand is the CPU usage of each of the OMEGAMON address spaces. I suggest doing something like looking at SMF30 record output (or an equivalent), for each of the OMEGAMON started tasks, and generate a report that will let you see a summary of CPU usage by task. Look at the data for a selected 24 hour period, and look for patterns in the data. For example, first look for which tasks use the highest CPU of the various OMEGAMON tasks. Different installations may have different tasks that use more CPU, when compared to the other tasks. It really will depend upon what OMEGAMONs you have installed, and what you have configured. Once you have identified which OMEGAMON started tasks are using the most cycles relative to the other OMEGAMON tasks, that will provide a starting point for where to begin your analysis.
When you are looking at optimizing OMEGAMON, the first thing to understand is the CPU usage of each of the OMEGAMON address spaces. I suggest doing something like looking at SMF30 record output (or an equivalent), for each of the OMEGAMON started tasks, and generate a report that will let you see a summary of CPU usage by task. Look at the data for a selected 24 hour period, and look for patterns in the data. For example, first look for which tasks use the highest CPU of the various OMEGAMON tasks. Different installations may have different tasks that use more CPU, when compared to the other tasks. It really will depend upon what OMEGAMONs you have installed, and what you have configured. Once you have identified which OMEGAMON started tasks are using the most cycles relative to the other OMEGAMON tasks, that will provide a starting point for where to begin your analysis.
Subscribe to:
Posts (Atom)

 Posts
Posts

