
You still run into shops where they have jobs going into loops, and it may be necessary to identify and address these tasks. OMEGAMON For z/OS V4.20 added an interesting number called the CPU Loop Index. The CPU Loop Index is a number that is calculated at the address space level that shows the relative likelihood that a given task on z/OS may be in a CPU loop. The notion is the more CPU heavy a task is, without any other indications of activity, such as I/O, the greater the likelihood that the task may be in a loop. The loop index is calculated up to 100. The closer to 100, the higher the possibility of a loop. Now it's not a guarantee that the task is in a loop, but it at least gives you an indication that the task is work taking a look at.
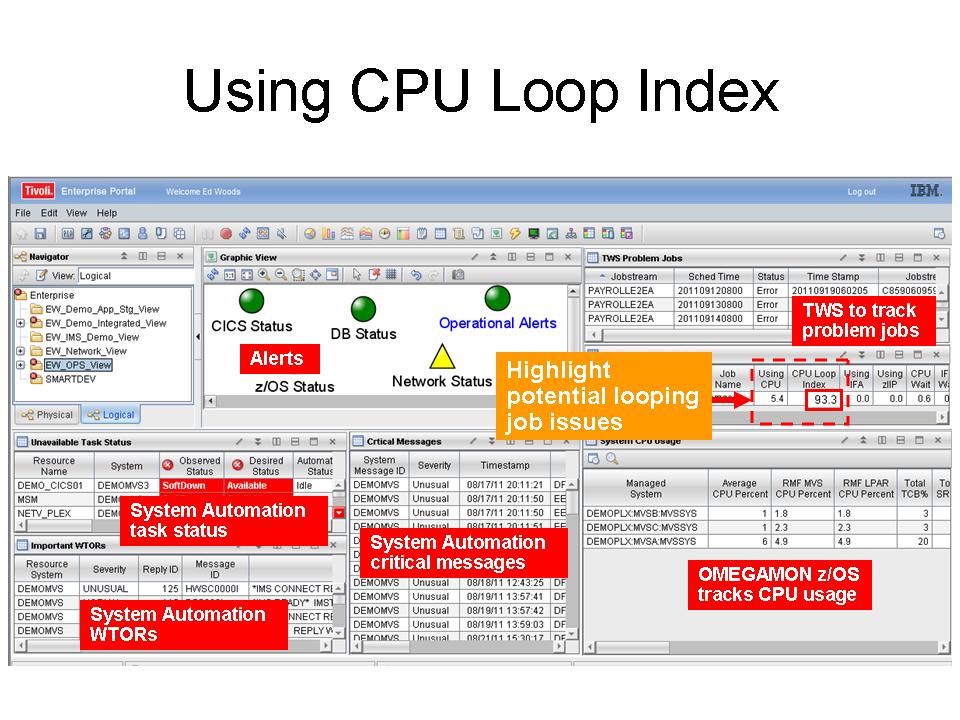
Here's an example of how I'm using this measure with a customer to highlight possible looping tasks. The example I have here is a customized availability view TEP workspace. This workspace is pulling in information from a variety of sources, including OMEGAMON, Tivoli Workload Scheduler, and System Automation to highlight potential issues, problem applications, and long running jobs.
To add the CPU Loop Index to this display, we made a copy of the standard OMEGAMON query for this table, and added a filter to it to only show jobs with an index greater than 50. This is recommended for performance reasons, since you will usually have hundreds of tasks on a z box. Why render all that data you don't need? We then apply a filter to the workspace to just show tasks above a certain level (such as 90 in this example).
It's an interesting number, feel free to take a look at it.


No comments:
Post a Comment
Note: Only a member of this blog may post a comment.