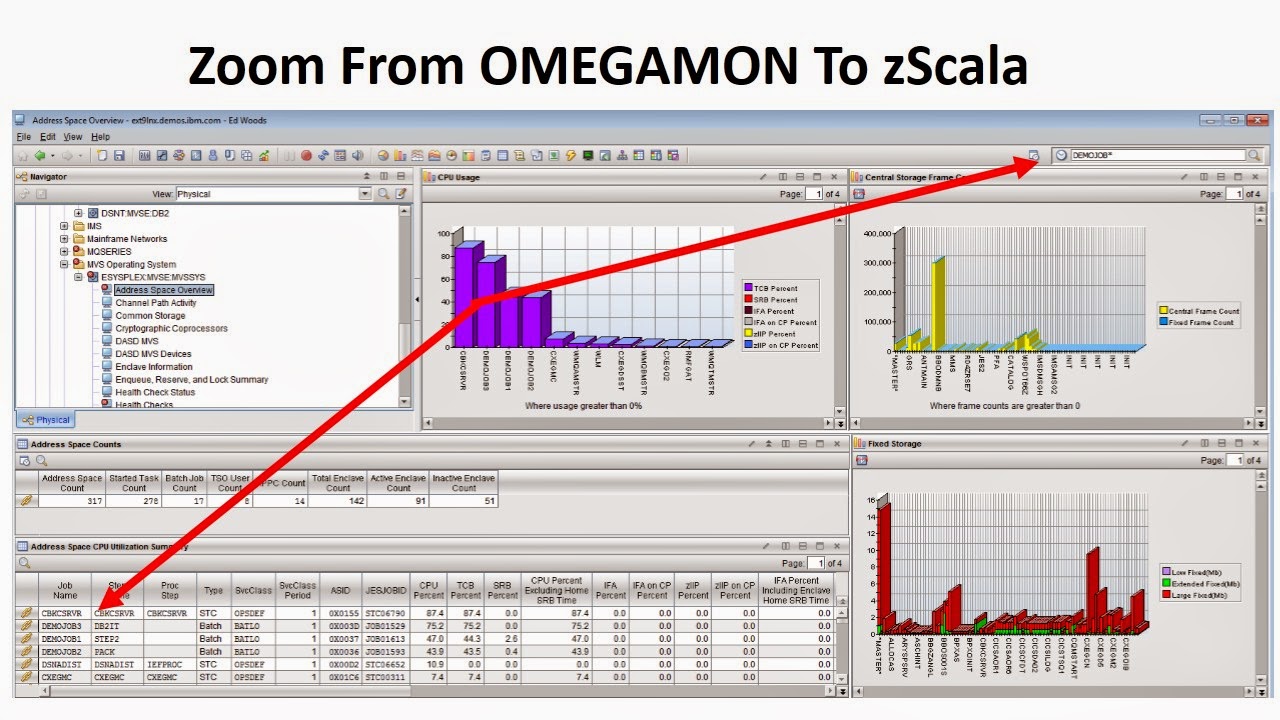
There is now an integration facility between the Tivoli Portal (TEP) interface of OMEGAMON and zScala. What this means is that if you are looking at an OMEGAMON monitoring display, and need to see console log messages for problem analysis, you now have an easy mechanism to do so.
Here is an example. From the TEP you can look at z/OS activity, such as Address Space monitoring. From this display if you want to look for relevant messages for a given address space, you can pass that information and click to see the messages.
In the above example we are looking at batch jobs, including DEMOJOB1, etc. To see any messages coming out of DEMOJOB1, you enter the information in the upper right field, and click to see the messages as retrieved from zScala. You see the messages below.


MQ Series MQ Series Training "
ReplyDeleteMQ Series Online Training
Send ur Enquiry to contact@21cssindia.com
Messaging Queue
What is MQ?
Purpose for using MQ
Advantages of MQ" more… Online Training- Corporate Training- IT Support U Can Reach Us On +917386622889 - +919000444287 http://www.21cssindia.com/courses/mq-series-online-training-115.html
Hi Ed,
ReplyDeleteDoes zScala have any capability to build dynamic threshold based on the found patterns?
Rafael Lima