IBM will be putting on a series of events in various cities, the "IBM System Availability Roadshow". It's an all day event and the agenda looks pretty solid (i.e. it's not a bunch of marketing fluff). Here's the agenda:
System Availability Overview
Explore the significant role that System z availability plays in
meeting your business objectives.
Creating End-to-End System Availability
Learn through key value scenarios how Tivoli integrated
solutions – including NetView for z/OS, OMEGAMON, and
System Automation – enable you to maintain optimal service
availability and performance.
Automation Deep Dive and Key Integration
Understand how Tivoli automation solutions improve the
availability of your system, network, and applications; thereby
reducing operator errors and maximizing resource efficiencies.
Network Management Deep Dive and Key Integration
Gain insights into how NetView for z/OS and OMEGAMON
solutions enable you to manage and optimize the availability and
performance of your TCP/IP and SNA networks.
Best Practices - Tailoring the solution for your needs
Utilize a problem solving approach to demonstrating how key
visualization, control, and automation capabilities of NetView for
z/OS based solutions can be tailored to meet the ever changing
demands of your enterprise.
The event will be in the following cities:
Tues, Oct. 4 Southfield 18000 W 9 Mile Rd, Rm 1505 Southfield, MI
Thurs, Oct. 6 Chicago 71 S. Wacker Drive, 6th Floor Chicago, IL
Tues, Oct 11 Markham 3600 Steeles Ave. East, D109 Markham, ON
Thurs, Oct 13 New York 590 Madison Avenue, Rm 1218 New York City
Tues, Oct 18 Hartford One Financial Plaza, 12th Floor Hartford, CT
Wed, Oct 19 Raleigh 3100 Smoketree Court, Rm 9002 Raleigh, NC
Thurs, Oct 20 Washington, DC 600 14th St, NW, Rm 356 Washington, DC
Tues, Oct 25 Atlanta Hillside 4111 Northside Parkway, 03F23 Atlanta, GA
Thurs, Oct 27 Dallas 13800 Diplomat Dr, Rm 232 Dallas, TX
Tues, Nov 1 San Ramon 4000 Executive Pkwy, Rm 340 San Ramon, CA
Thurs, Nov 3 Costa Mesa 600 Anton Blvd, Rm 209 Costa Mesa, CA
If you are interested, email Joanie Gines jgines@us.ibm.com to enroll.
Friday, September 30, 2011
Thursday, September 29, 2011
An example of using the OMEGAMON z/OS CPU Looping Index indicator
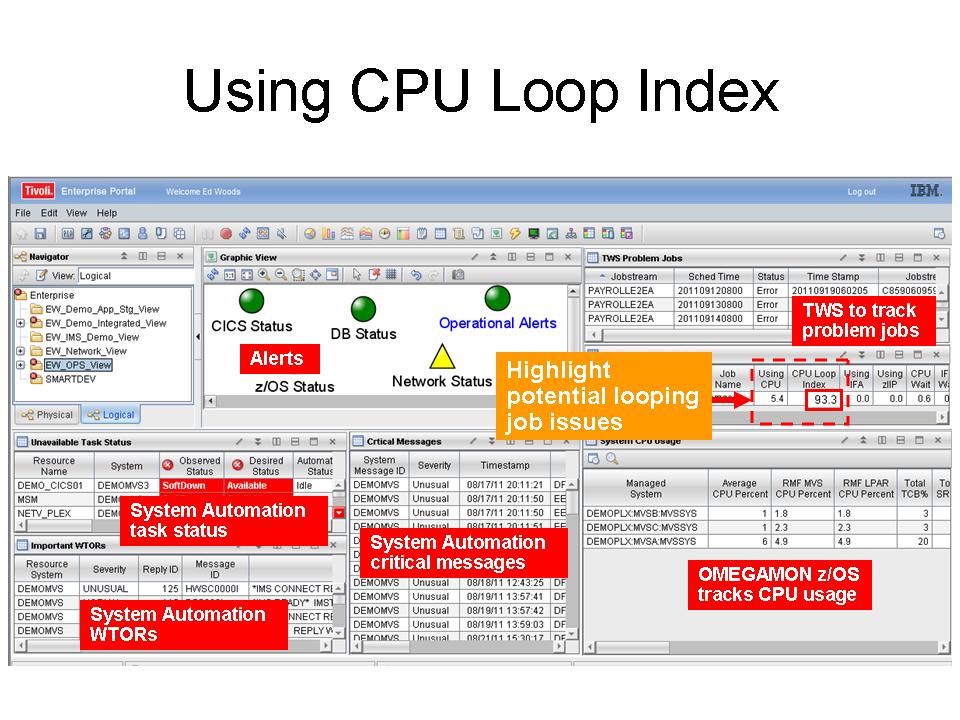
You still run into shops where they have jobs going into loops, and it may be necessary to identify and address these tasks. OMEGAMON For z/OS V4.20 added an interesting number called the CPU Loop Index. The CPU Loop Index is a number that is calculated at the address space level that shows the relative likelihood that a given task on z/OS may be in a CPU loop. The notion is the more CPU heavy a task is, without any other indications of activity, such as I/O, the greater the likelihood that the task may be in a loop. The loop index is calculated up to 100. The closer to 100, the higher the possibility of a loop. Now it's not a guarantee that the task is in a loop, but it at least gives you an indication that the task is work taking a look at.
Here's an example of how I'm using this measure with a customer to highlight possible looping tasks. The example I have here is a customized availability view TEP workspace. This workspace is pulling in information from a variety of sources, including OMEGAMON, Tivoli Workload Scheduler, and System Automation to highlight potential issues, problem applications, and long running jobs.
To add the CPU Loop Index to this display, we made a copy of the standard OMEGAMON query for this table, and added a filter to it to only show jobs with an index greater than 50. This is recommended for performance reasons, since you will usually have hundreds of tasks on a z box. Why render all that data you don't need? We then apply a filter to the workspace to just show tasks above a certain level (such as 90 in this example).
It's an interesting number, feel free to take a look at it.
Tuesday, September 20, 2011
Upcoming webcast on OMEGAMON and the Tivoli Enterprise Portal
On September 29th I will be doing a webcast, "Top 10 Problem Solving Scenarios Using OMEGAMON and Tivoli Enterprise Portal". In this presentation I will cover how OMEGAMON and the Tivoli Enterprise Portal can be used to identify, isolate, and solve typical z/OS performance and availability management issues.
The session will include examples of how to get the most out of OMEGAMON and the Tivoli Enterprise Portal, and discuss the integration of OMEGAMON with other Tivoli solutions. I will also be covering some things I've been blogging about lately, such as ITM 6.2.3 and the Tivoli Performance Analyzer.
The event is September 29th at 11AM. The price to attend is right (it's free). Please feel free to stop by.
http://www.ibm.com/software/systemz/telecon/sep29
Summary of what's in ITM 6.2.3
As I mentioned a few days ago, ITM 6.2.3 is now available. There are quite a few interesting enhancements in ITM 6.2.3. I've mentioned a couple things already, including self-describing agents and Tivoli Performance Analyzer. Here's a summary of the more interesting stuff in ITM 6.2.3:
Some interesting stuff, in particular the interface with TADDM. Imagine the notion of being able to integrate configuration and change management with monitoring? After all, what's the biggest cause of unplanned outages? How about changes.
§Application Support Mismatch
–Show new or updated application support event (Note – not yet supported on z/OS yet)
§Tivoli Performance Analyzer now a base component of IBM Tivoli Monitoring
–Adds predictive capability to Tivoli Monitoring
–Monitor resource consumption trends, anticipate future performance issues
§Situation event console and Common event console enhancements
§Manually started situation enhancements
–
§Historical data compression before upload to TDW
–Reduce network traffic, data collected from distributed monitoring agents is now compressed in memory at the collection location
§New and enhanced CLI tacmd commands
§Tivoli Application Dependency Discovery Manager policies
–Create policies that interact with your Tivoli Application Dependency Discovery Manager (TADDM) environment
–Policies can forward events such as, new, changed, or destroyed resources to your Tivoli Application Dependency Discovery Manager server
Some interesting stuff, in particular the interface with TADDM. Imagine the notion of being able to integrate configuration and change management with monitoring? After all, what's the biggest cause of unplanned outages? How about changes.
§
Friday, September 16, 2011
Check out Destination z
"Destination z" is a community consisting of Systems z users, educators, business partners and IBMers. Destination z is intended to spread the word on the latest on System z technology, trends and resources.
There are lots of good links, and sources of information. Membership in Destination z is open to System z customers, IBMers, IBM business partners and qualifying academic institutions (educators and students).
To join go to: www.destinationz.org/join
What is Tivoli Performance Analyzer?
Earlier this week I mentioned that ITM 6.2.3 would be bringing in new feature/function. Tivoli Performance Analyzer in the past has been an add-on component to the ITM infrastructure. With ITM 6.2.3, Tivoli Performance Analyzer becomes part of the base tool.
What is Tivoli Performance Analyzer? At its core, it's intended to add predictive capability to Tivoli Monitoring so you can monitor resource consumption trends, anticipate future performance issues, and avoid or resolve problems more quickly. For example, you can use Tivoli Performance Analyzer to predict application bottlenecks and create alerts for potential service threats.
So, how does it work? Tivoli Performance Analyzer works by analyzing information in the Tivoli Data Warehouse (TDW) and providing an analysis of trends gathered from that data. The user may specify different analysis scenarios, based on what history data is being collected by the user, and the requirements of the user. You have various trending options, such as linear trending or arithmetic trending, and you can use it to calculate such things as time to hit a given threshold.
Tivoli Performance Analyzer works in unison with the TDW, and provides some interesting new analytic capabilities for ITM monitoring solutions (including OMEGAMON). Here's a manual number for more information: SC27-4004-00.
Wednesday, September 14, 2011
IBM Tivoli Monitoring (aka ITM) 6.2.3 version is now available
It's been a couple weeks now, but ITM 6.2.3 is now available. Don't get ITM 6.2.3 confused with ITM 6.2.2 fixpack 3. ITM 6.2.3 is a new version of the IBM Tivoli Monitoring infrastructure.
What's new in ITM 6.2.3? Quite a few things of interest. Probably the most intriguing and potentially the most powerful is a feature known as self-describing agents. Tired of having to worry so much about application CDs, CAT and ATR files, and looking at ITMSUPER output to identify mismatches in support levels for various agents? Self describing agents makes that process less of a chore. What does it mean? Agents will communicate their application support requirements to the infrastructure dynamically. The infrastructure becomes more flexible and dynamic as a result.
There's a lot more in ITM 6.2.3 that I will be covering over the next few days. To get started on ITM 6.2.3, here's a link:
https://www.ibm.com/developerworks/mydeveloperworks/blogs/0587adbc-8477-431f-8c68-9226adea11ed/entry/ibm_tivoli_monitoring_6_2_3_version_is_now_ega3?lang=en
Friday, September 9, 2011
Interested in capacity planning and System z? Check out this webcast.
If you are interested in System z and capacity planning, there is a webcast next week on September 15th on the topic. Attend "Optimize IT hardware and software expenditures with Tivoli capacity planning and IBM business analytics" to learn about Tivoli “what if” analysis, the Tivoli open architecture for gathering and analyzing data, and application performance modeling and rich graphical reporting.
The webcast will cover the following topics:
http://www-01.ibm.com/software/sw-events/teleconference/T805130X92184D07.html
The webcast will cover the following topics:
- Collecting historical log data on IT utilization to use in performance reporting and usage accounting
- Forecasting and modeling data relationships at the application level
- Using simulation to conduct “what if” analyses that help you avoid unnecessary costs
- Reading, normalizing and storing data for service level optimization
- Delivering business intelligence to be used for predictive analytics
http://www-01.ibm.com/software/sw-events/teleconference/T805130X92184D07.html
Wednesday, September 7, 2011
Use ITCAM to identify mainframe as well as distributed bottlenecks

ITCAM (IT Composite Application Monitoring) provides a detailed and dynamic analysis of application transaction flow, and shows end to end application response time, along with aiding in the identification of transaction bottlenecks. What's powerful about ITCAM is it has the ability to 'stitch' together information from a variety of sources to determine the application flow, and show performance information. This end to end perspective could conceivably flow between mainframe and distributed, and encompass various middleware components in between.
The example screenshot shows a distributed client that connects to the mainframe via IMS Connect, and then invokes various IMS transactions. When you look at the example you can see that IMS Connect is the potential bottleneck, and the IMS Connect portion of the response time is highlighted in red on the bottom portion of the screen. This is a fairly straightforward example of how this function operates.
ITCAM is flexible, powerful, and allows you to see where your complex composite applications are spending their time.
Thursday, September 1, 2011
Logs logs, where are my logs?
Tivoli distributed and OMEGAMON mainframe kicks out lots of logs and even more messages. These logs can be useful when it comes to problem analysis, and determining why a component may not be functioning as desired.
The logs that are available, and the format of the logs may vary by platform or component. If you want a listing of all the various available logs, here is a link to a handy little document that summarizes where the various logs reside:
https://www-304.ibm.com/support/docview.wss?mynp=OCSSZ8F3&mync=R&uid=swg21502429&myns=swgtiv
Information on z/OS 1.13 OMEGAMON currency maintenance
z/OS 1.13 is coming out, so the question is what, if any, maintenance may be required for OMEGAMON in a z/OS 1.13 environment? The good news is OMEGAMON currency support for z/OS 1.13 is provided for Version 410, 420 and later releases of OMEGAMON XE z/OS products.
Here's a link to a document that lists what, if any, OMEGAMON maintenance is required. Here's the link:
https://www-304.ibm.com/support/docview.wss?mynp=OCSSUSPS&mync=R&uid=swg21512105&myns=swgtiv
By the way, if you are interested in z/OS 1.12 maintenance, here's a link for that, as well:
https://www-304.ibm.com/support/docview.wss?uid=swg21429049
Subscribe to:
Posts (Atom)

